The Pod Dashboard
Track one Pod's calls, cost, concurrency and campaigns, broken down by inbound, outbound, web widgets and activity outside campaigns.
Written By voiceaiwrapper
Last updated 26 days ago
The Pod Dashboard shows how one Pod (an engine or provider connection) is performing: how many calls it handled, what they cost, how often outbound calls connect, how many inbound callers were new, and which campaigns are busiest. Use it when you want detail for a single Pod. For totals across all Pods, use The Account Dashboard.
To open it, select the Pod you want in the Pod selector, then click Pod Dashboard in the sidebar under POD:. If your organization has a single VAW Native Pod, the item is called Dashboard and it's also your home page.
Choose the date range and timezone
Use the controls at the top right of the page:
- Date range: click the date button to open a two-month calendar, or pick a preset such as Last 7 Days or This Month on a wider screen. The Pod Dashboard opens on the last 7 days.
- Timezone: used to group calls into days and hours. It starts on your browser's timezone.
The KPIs, charts, top campaigns and recent calls all follow the date range. The Resources on this pod tiles don't: they show current counts and all-time totals.
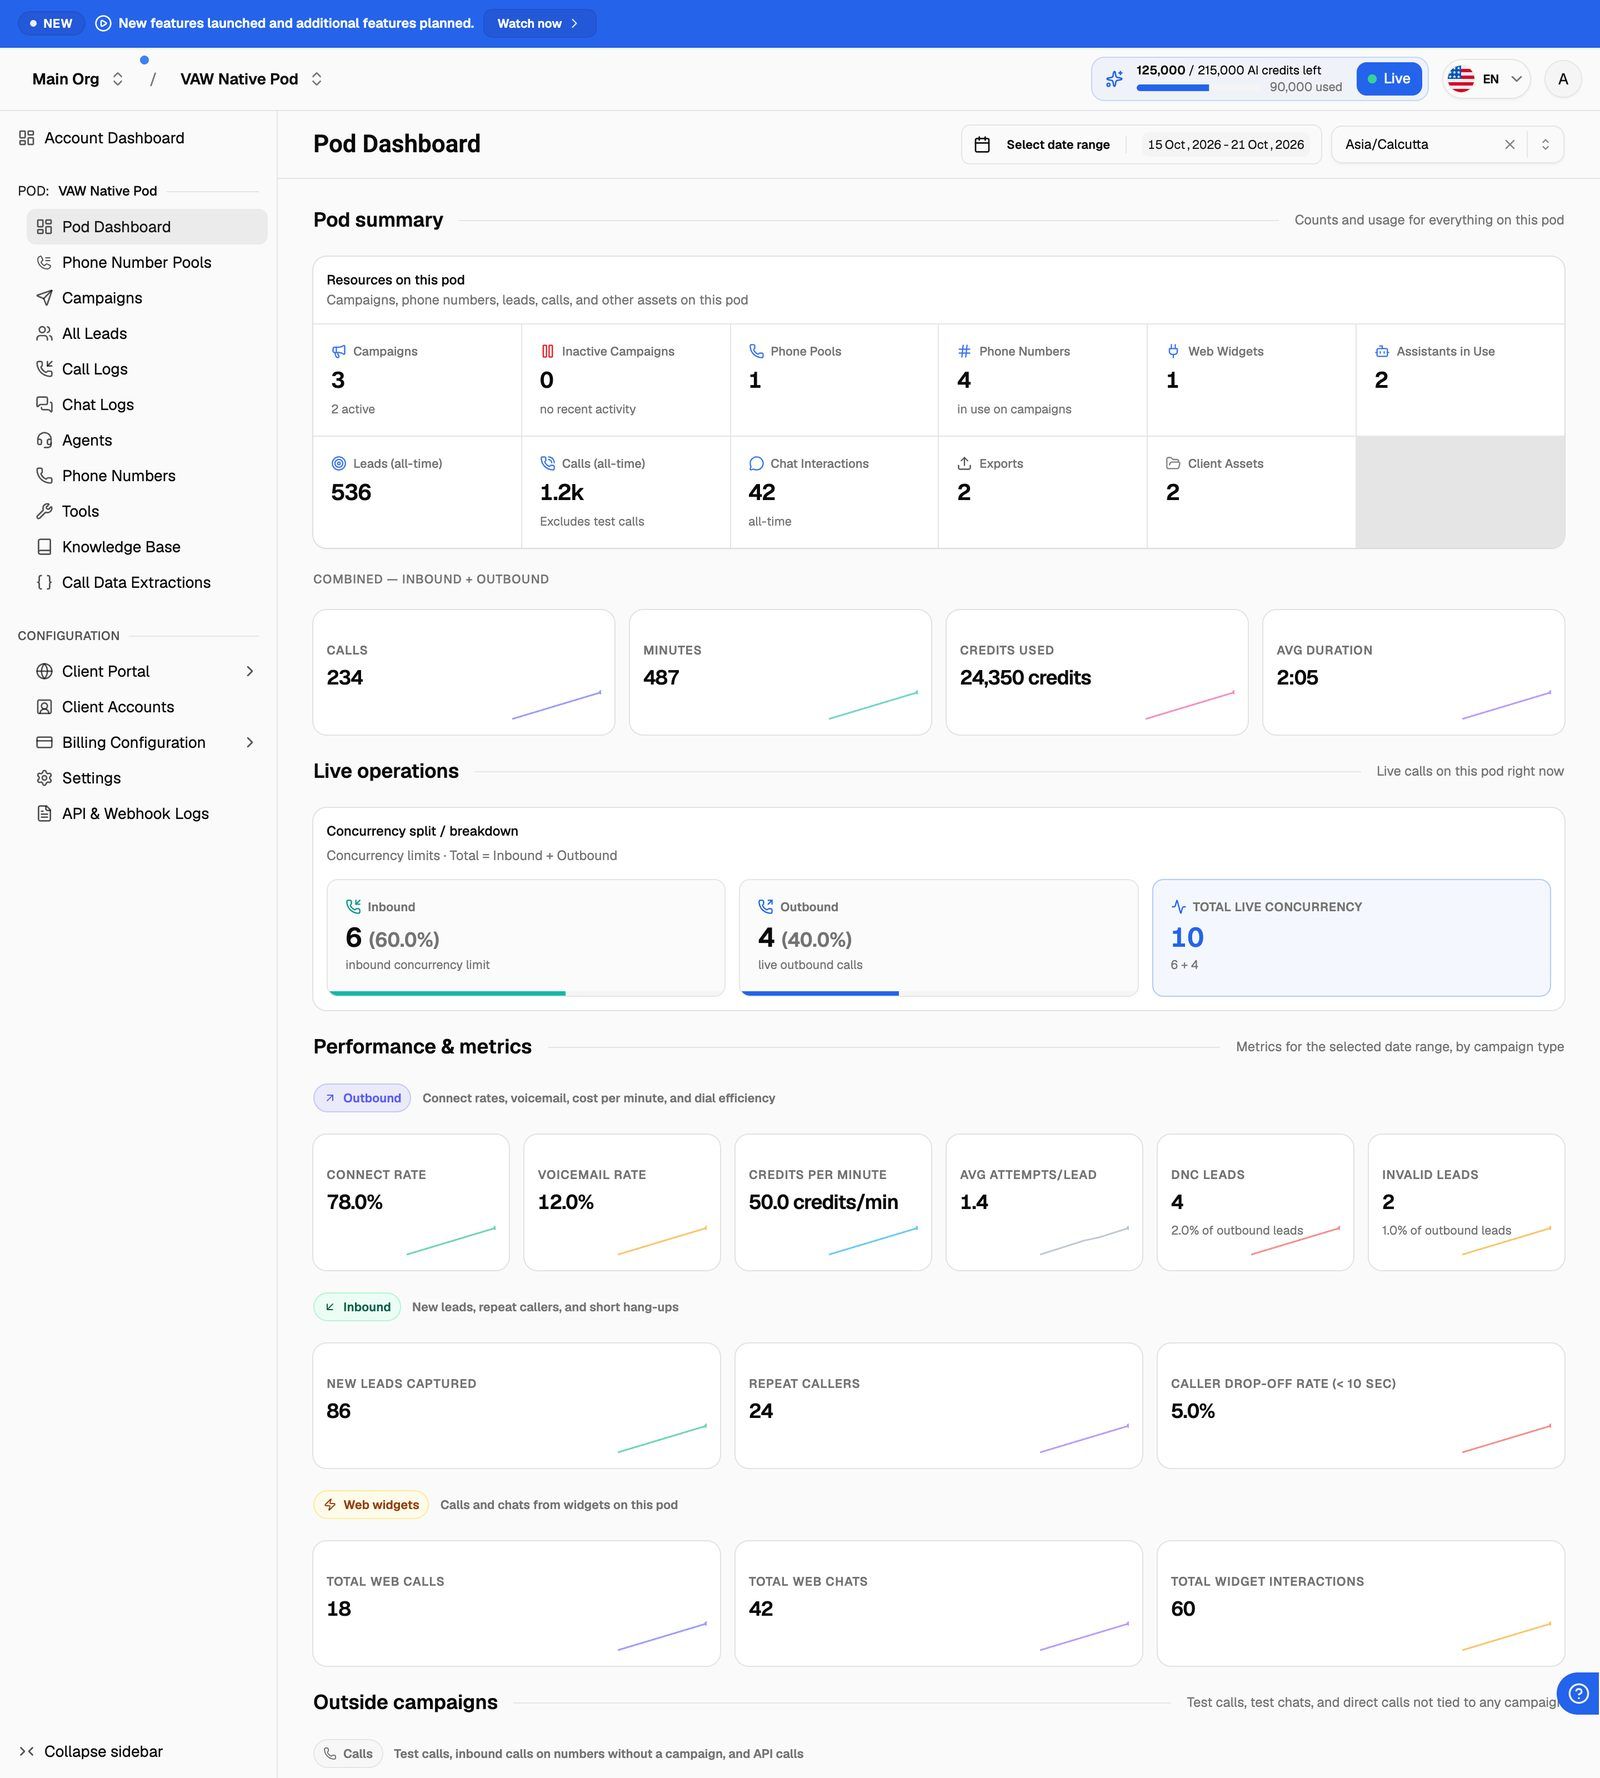
Pod summary
Resources on this pod counts everything attached to the Pod: Campaigns, Inactive Campaigns, Phone Pools, Phone Numbers in use on campaigns, Web Widgets, Assistants in Use, Leads (all-time), Calls (all-time) (test calls excluded), Chat Interactions, Exports and Client Assets.
The Combined — Inbound + Outbound row below it gives the period totals: Calls, Minutes, Spend (or Credits used) and Avg Duration. Each KPI has a trend line for the period.
Spend is shown in the Pod's own unit
Live operations
The Concurrency split / breakdown card shows how this Pod's concurrency limit is split: the Inbound limit, the Outbound limit, each as a share of the total, and Total live concurrency (Inbound + Outbound). These are the limits you set, not a count of calls happening right now. To change the split, see Split Concurrency Between Inbound and Outbound Calls.
Performance by channel
Performance & metrics splits the period's campaign calls by type. Test calls aren't included.
A few definitions:
- Connect Rate is the share of outbound calls that were answered: calls with talk time, minus calls your provider marked as voicemail.
- Voicemail Rate is the share of outbound calls your provider marked as voicemail. VAW Native doesn't detect voicemail yet, so on a VAW Native Pod it stays at 0%.
- Cost per minute divides spend by answered talk time, so calls that cost money but weren't answered push it up.
- Caller Drop-off Rate (< 10 sec) is the share of inbound calls that lasted under 10 seconds.
Outside campaigns (VAW Native only)
VAW Native Pods get an extra Outside campaigns section for conversations that aren't tied to a campaign:
- Calls: test calls, inbound calls on numbers without a campaign, and API calls. Shows Calls (split into test, inbound and outbound), Connect Rate, Minutes, Avg Duration and Credits used.
- Chats: test chats started from the dashboard. Shows Chats, Messages and Credits used.
Trends and campaigns
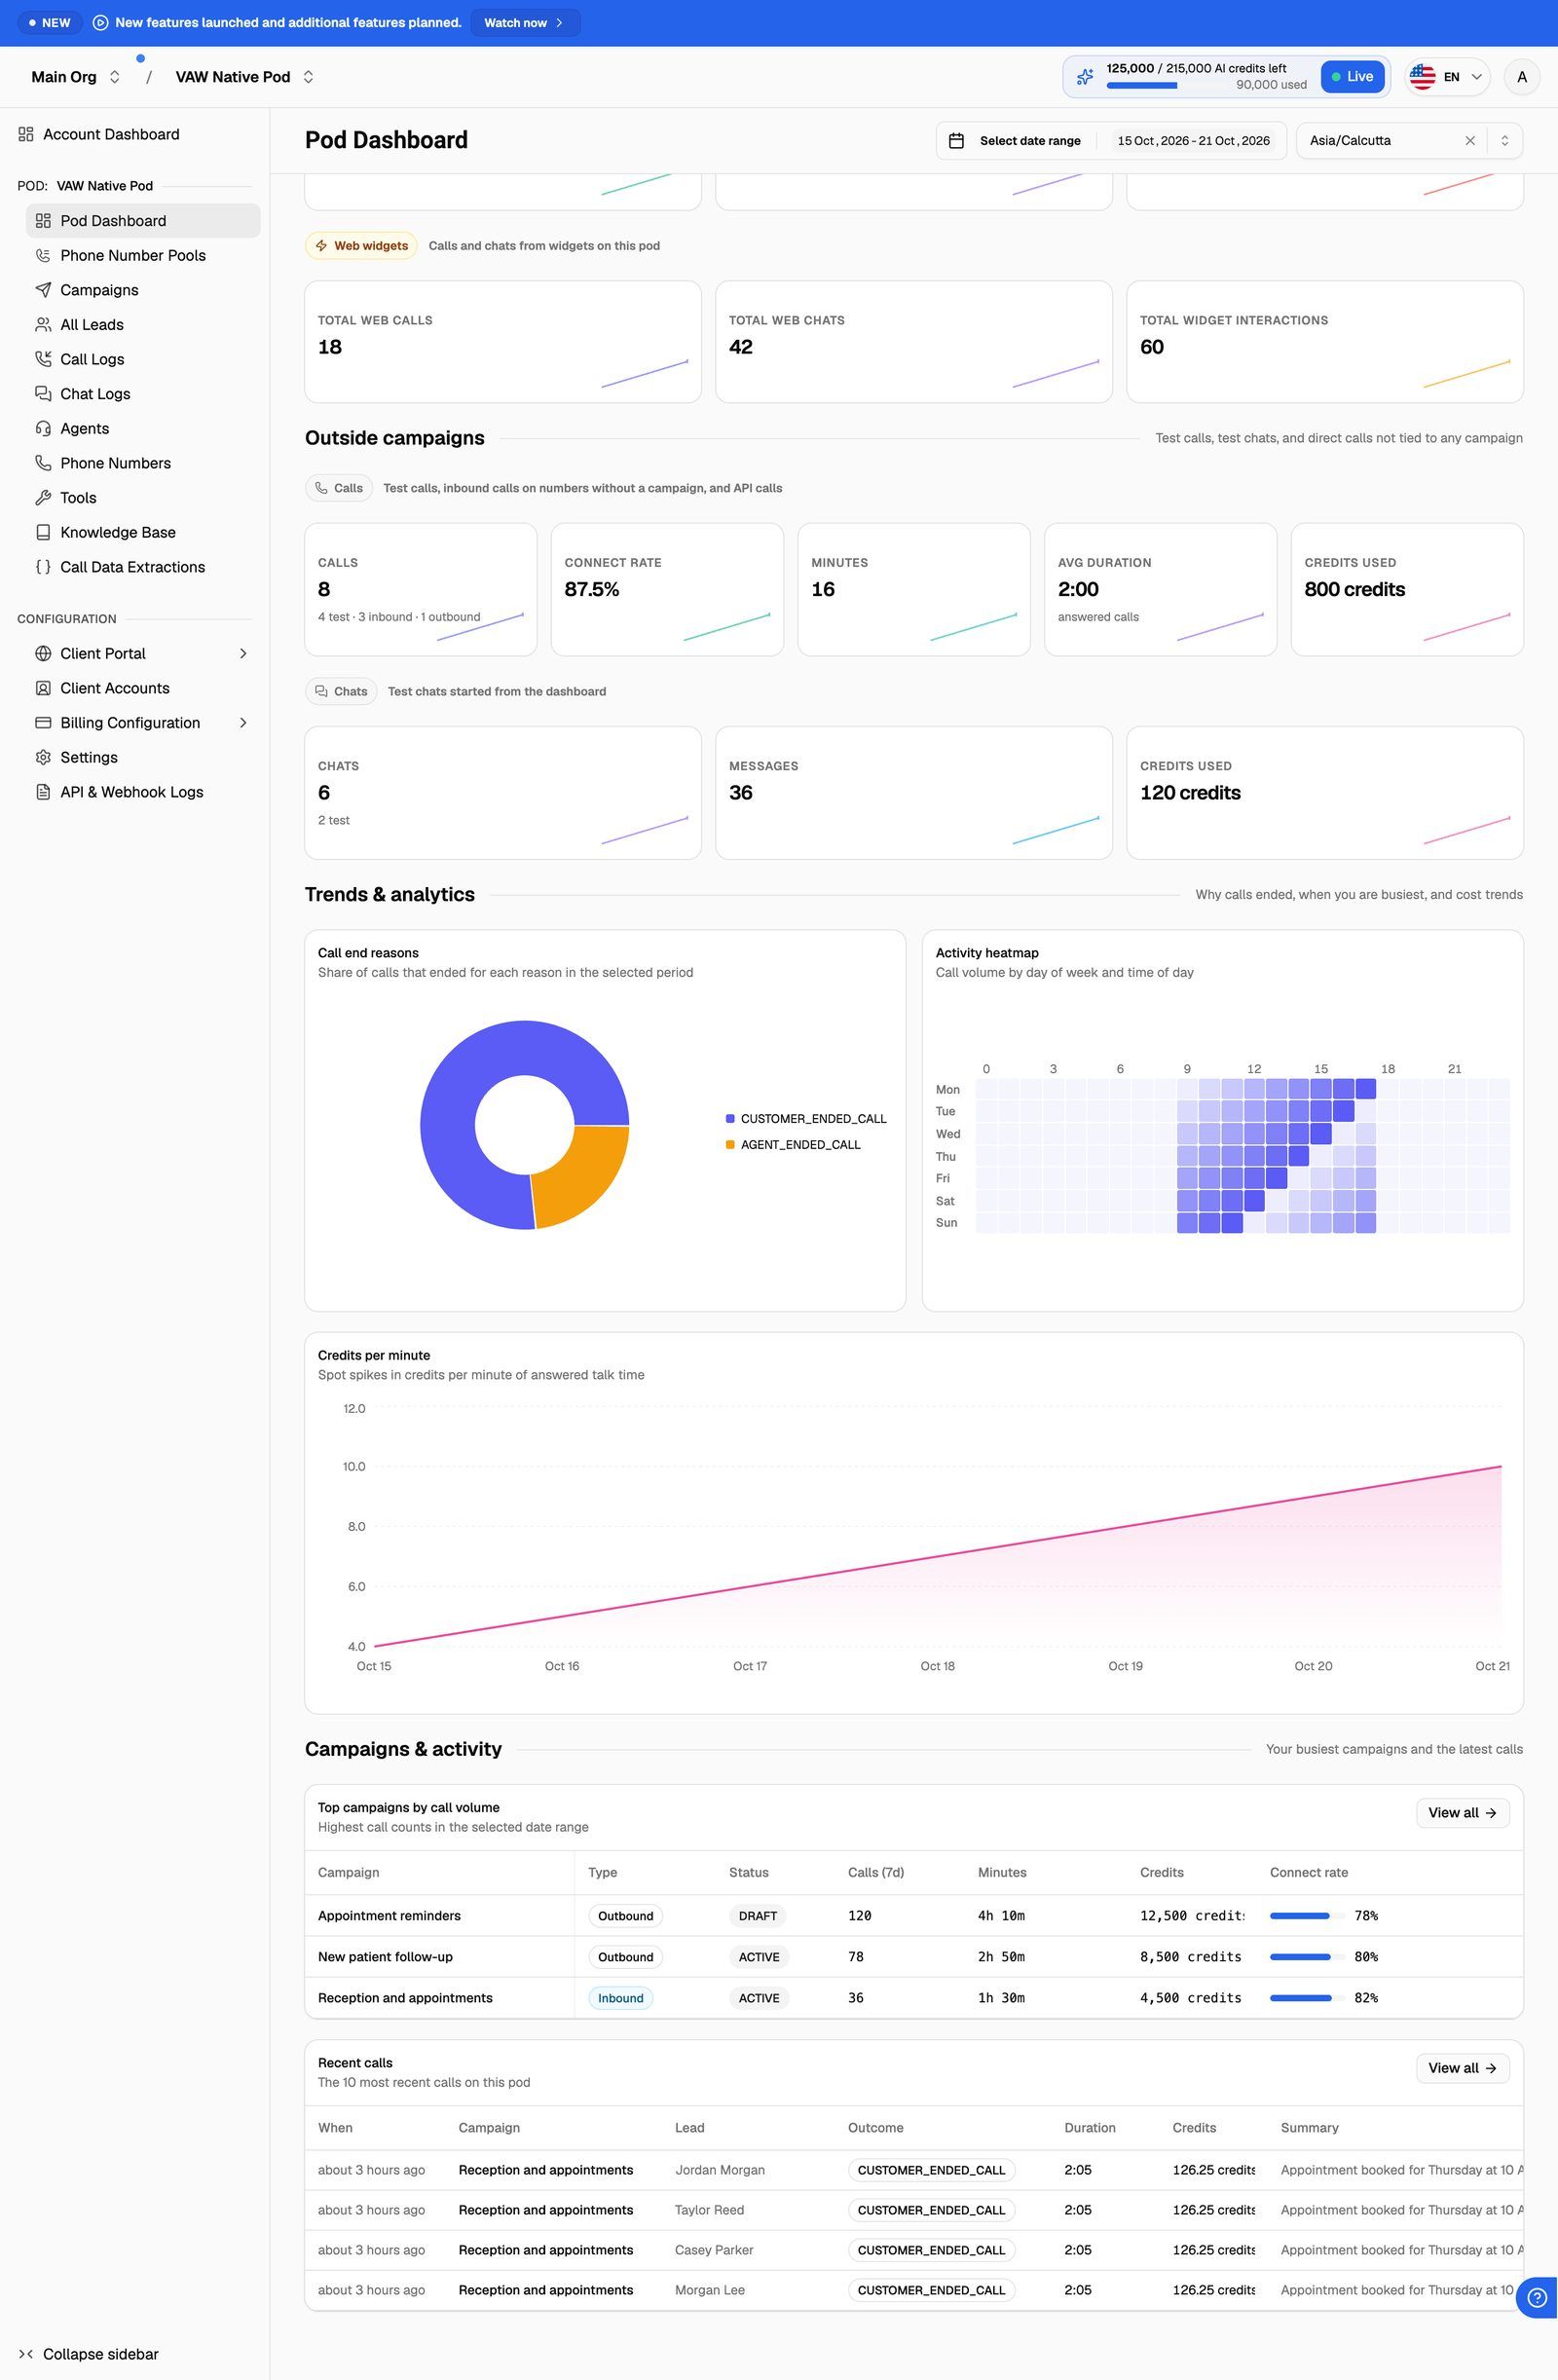
Trends & analytics has three charts:
- Call end reasons: the share of calls that ended for each reason. A large slice of failures or no-answers is the first thing to look into. See Call Statuses and End Reasons.
- Activity heatmap: call volume by day of week and time of day.
- Cost per minute or Credits per minute over time (not shown for Ultravox Pods).
Campaigns & activity has two tables:
- Top campaigns by call volume: the 5 campaigns with the most calls in the period, with each one's type, status, calls, minutes, spend (or credits) and connect rate. Click View all to open the Campaigns page.
- Recent calls: the 10 most recent campaign calls in the period (test calls excluded), with when, campaign, lead (phone numbers are masked to the last four digits), outcome, duration, cost and summary. Click View all to open Call Logs.
Other panels you may see
- Inactive campaigns: if any of this Pod's campaigns have been flagged for cleanup, an Action required card appears at the top with Snooze for N days and Delete now buttons. It works the same as on the Account Dashboard. See "Deal with inactive campaigns" in The Account Dashboard.
- VAW Assistant banner: on Vapi, Retell AI and ElevenLabs Pods, a banner offers to build a ready-to-call agent (an assistant on Vapi) in your provider account from an industry template. See Build a Provider Agent with VAW Assistant.
Frequently asked questions
My test calls don't show in the KPIs.
My test calls don't show in the KPIs.
The main KPIs only count real campaign calls. On a VAW Native Pod, test calls and chats appear under Outside campaigns. Every call, including tests, is listed in Call Logs.
Why is Cost per minute missing?
Why is Cost per minute missing?
The Cost per minute KPI and chart aren't shown for legacy Ultravox Pods. Use Spend in the Combined — Inbound + Outbound row instead.
The numbers differ from my provider's dashboard.
The numbers differ from my provider's dashboard.
The Pod Dashboard only counts calls that went through your campaigns (plus the Outside campaigns section on VAW Native). Calls you placed directly in your provider's dashboard aren't included.
Related articles
Was this helpful?
Still need help? Share an idea