Call Details: Transcript, Recording, Analysis, Variables and What Ran
Review a single call: read the transcript, play or download the recording, check the analysis, see the variables, the cost breakdown and webhook deliveries.
Written By voiceaiwrapper
Last updated 26 days ago
When you click a call in Call Logs or in a campaign's Calls tab, its details open in a panel over the list. This is where you find out what actually happened on a call: what was said, how it sounded, whether it succeeded, which data the agent had, what it cost and whether your webhook received it.
Most of this article covers calls on a VAW Native Pod (an engine or provider connection). Calls on Vapi, Retell AI and ElevenLabs Pods open a simpler screen built from your provider's data; see the last section, "Calls on Vapi, Retell AI and ElevenLabs".
The call panel at a glance
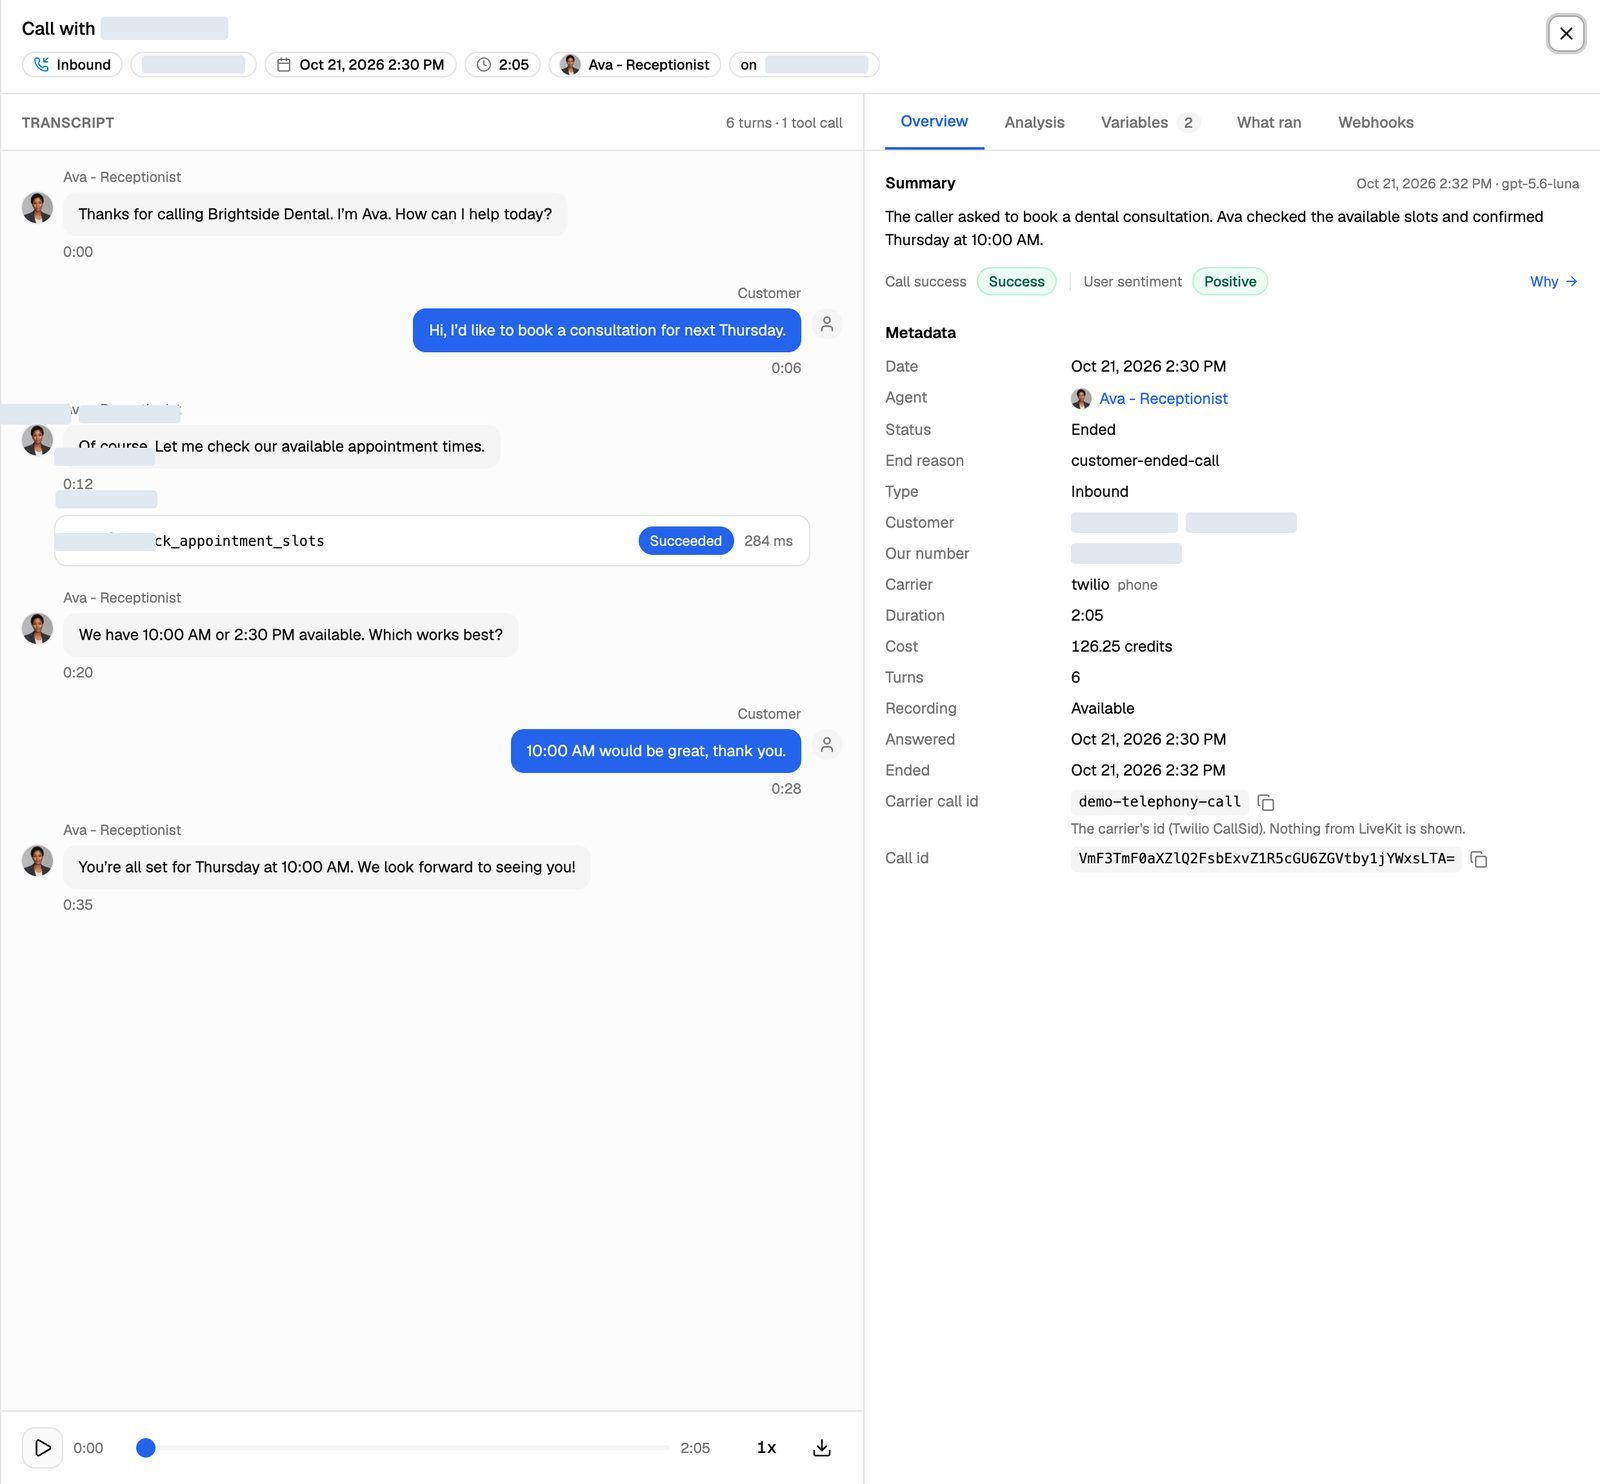
The header shows Call with the customer's name or number (or Web test for a browser or widget call), plus pills for the call type, the customer's number, the date, the duration, the agent and on the number the agent used.
Below the header:
Left: the transcript, with the recording player underneath.
Right: the tabs Overview, Analysis, Variables, What ran and Webhooks.
While a call is live, or while its analysis is still being written, the panel updates on its own. A live call shows its status in the title and the duration says "and counting".
Read the transcript
The agent's turns are on the left, labelled with the agent's name, and the Customer's are on the right. The Transcript heading counts the turns and tool calls.
Jump to a moment: click the timestamp under any message to play the recording from that point.
Tool calls appear between the turns as compact cards with the tool's name and a status badge. A changes data badge means the tool writes to another system, such as booking an appointment. Click a card to open it and see what the agent sent (From the conversation and Filled in from call data and settings), what came back (The agent heard, The agent received and The answer), anything Saved for later tools, and The tool as it was when this ran.
Text messages sent during the call show the message under The text, plus its delivery status: Delivered, Not delivered with a reason, Sent to Twilio or No delivery report received.
Transfers: when a call was handed over to a person, a dashed line reads "transferred to … · recording continues · transcript ends here". For a warm transfer, you'll also see what the agent told the person before connecting the call. Transfers that didn't connect show as ordinary tool cards, and the transcript carries on.
If nobody spoke, you'll see "Nothing was said on this call." If there are no turns for another reason, for example because the transcript was removed under your retention settings, you'll see "No transcript is available for this call." If a very long transcript went past the analysis limit of 120,000 characters, a note explains that the report was written from a shortened copy. The full transcript is still shown.
To set up tools and transfers, see Built-In Tools: End Conversation, Transfer Call and Send SMS.
Play and download the recording
The player has play and pause, a seek bar, a speed button (1x, 1.5x, 2x) and a download icon. Download recording saves the audio file. The download link is signed and only valid for a short while, so download from the panel rather than sharing the link.
If there's no player, the message tells you why:
To change recording and retention, see Call Settings: Recording, Silence Timeout and Maximum Call Length.
Overview tab
The top shows the Summary, Call success and User sentiment from the analysis report. Click Why to jump to the full reasoning on the Analysis tab.
Metadata lists the facts about the call: Date, Agent, Status, End reason, Type, Customer, Our number, Carrier, Duration, Cost (in credits), Turns, Recording, Answered, Ended, Carrier call id and Call id. The Carrier call id is Twilio's ID for the call (the CallSid), which helps when you contact Twilio support. Use the copy buttons to grab IDs.
If Cost says "analysis pending", the total can still grow while the post-call analysis runs.
Analysis tab
About a minute after a call ends, the analysis model reads the transcript and writes a report with:
Summary
User sentiment
Call success, including each checklist item if you use a checklist rubric (items marked required must pass)
Custom data: the results of your Call Data Extractions, with each field's reasoning
The model that wrote it and how many tokens it used
Click How this is judged to open the agent's Analysis tab and change the rubric.
While the report is being written, the tab says it usually lands within a minute and updates on its own. If there's no report, the tab says why. Common reasons are that nobody answered, the call reached voicemail, the call was too short (a report needs at least one turn from each side), analysis is turned off for the agent, or the agent was deleted after the call. A skipped call isn't charged for analysis.
Learn more in Post-Call Analysis: Summary, Sentiment and Call Success.
Variables tab
Shows the data the agent had, in three groups. Switch between Fields and JSON to change the view.
Passed in: values sent with the call, from the test panel, an outbound call request or the number's inbound context. A count badge on the tab shows how many there were.
Provided by the system: values filled in when the call started, such as the date and time in the agent's timezone. Your prompt can use them as
{{system.*}}.Saved by a tool: values a tool wrote during the call for tools that ran later. The prompt and greeting had already been prepared, so they didn't see these.
Passed-in values are capped at 4,096 bytes. See Use Call Data and Variables in Your Prompt.
What ran tab
Agents can be edited at any time, and they don't keep a version history. What ran is a snapshot of what this call actually used, even if the agent has changed since.
Snapshot at call start: the agent, the AI model (with its reasoning and temperature settings), the voice and its speed, the transcriber, the language, the time limit, whether recording was on, and the analysis model.
Cost: one line per part of the call, with the model and provider where relevant, and a Total in credits.
Tools available: every tool the agent could use on this call, marked "used N times" or "not used".
The cost lines are:
A line marked "not measured" had no usage recorded. Older calls may say "Cost was not tracked for this call." For how credits work, see Credit History and Per-Call Costs.
Webhooks tab
This tab shows each webhook event sent for this call under Call events, and whether it arrived. Events are only sent when the agent has a webhook URL. The tab is only in your webapp; clients don't see it.
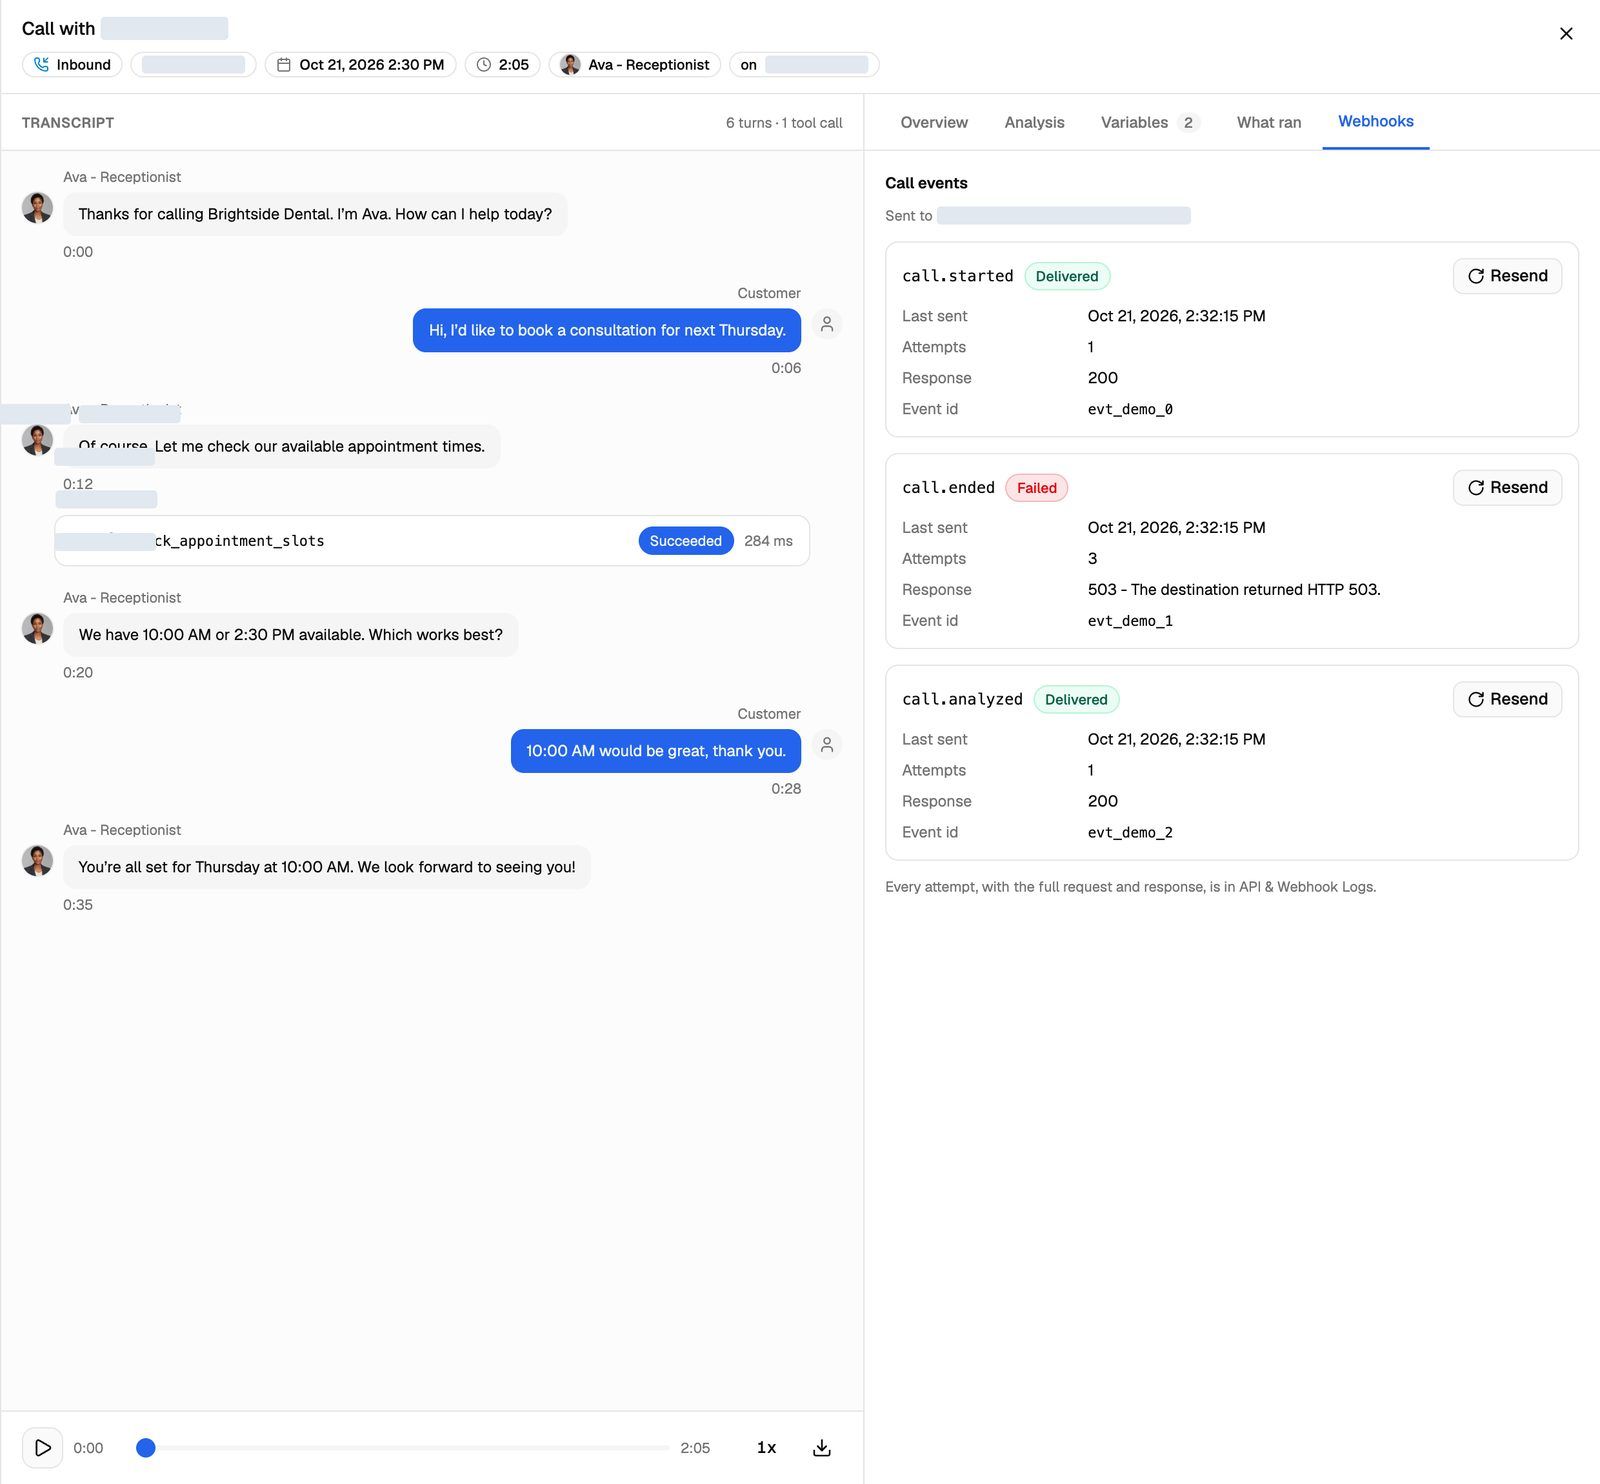
Each event card shows a status badge (Delivered, Retrying, Failed or Pending), Last sent, Attempts, the Response (HTTP status code or error), Next attempt while it's retrying, and the Event id.
To send an event again, for example after fixing your server, click Resend on its card. It isn't available while the event is still Pending. Your server receives the event again, so make sure it can handle a repeat.
If the call came in on a number with an inbound webhook, an Inbound webhook section shows the Outcome: whether your server answered (and how fast, whether it chose the agent, and how many variables it returned), rejected the call, or gave no usable answer so the assigned agent answered.
If the agent had no webhook URL when the call ran, you'll see "No webhook URL was set on the agent when this call ran, so no events were sent." Every attempt, with the full request and response, is also in API & Webhook Logs. To set up the webhook, see VAW Native Agent Webhooks: Events and Delivery.
What your clients see
Clients with access to Call Logs in their portal open the same panel, without the Webhooks tab and without any costs. Which tabs they see, and whether they can read the transcript, play the recording or download it, depends on the permissions you give them. See Set Client Permissions on VAW Native Workspaces.
Calls on Vapi, Retell AI and ElevenLabs
Calls on these Pods open a screen built from the data your provider sends back. It has no What ran, Variables or Webhooks tabs.
Header: Call with the lead (or Web Call / Test Call) and the Call Log ID, with Copy Call Log ID.
Left column: the lead's details (ID, Email, Phone, Fields) with an Edit lead button, the Recording player, and the provider's analysis.
Right column: the transcript, labelled Assistant on Vapi and Agent on the other providers.
The analysis sections depend on the provider:
Legacy Bolna and Ultravox Pods have similar screens with their own fields. To change what your provider analyses, edit the agent in your provider's dashboard. See Capture Lead Details from Provider Calls.
Troubleshooting
The Analysis tab says the report was skipped.
The Analysis tab says the report was skipped.
The reason is shown on the tab. A report needs at least one turn from each side, so calls nobody answered, calls that reached voicemail and very short calls are skipped. If it says analysis is off, open the agent's Analysis tab and turn on Analyze calls. New calls get a report from then on.
The download button opens an error page.
The download button opens an error page.
The signed link expired. Close and reopen the call panel, then download again.
A webhook shows Failed.
A webhook shows Failed.
Check the Response row for the status code or error your server returned, fix the problem, then click Resend. If you need the full request and response, open API & Webhook Logs. See My Webhook Isn't Receiving Data.
Related articles
Was this helpful?
Still need help? Share an idea