Campaign Analytics
Read a campaign's Analytics tab: outbound and inbound KPIs, cost metrics only you can see, call end reasons, and how to set the date range and timezone.
Written By voiceaiwrapper
Last updated 26 days ago
The Analytics tab shows how a single campaign is performing: how many leads you reached, how many calls connected, how long people talked, what it cost you and why calls ended. Use it to compare time periods, spot a drop in connect rate, or work out what a campaign costs per answered call before you set your client pricing.
Every campaign has an Analytics tab, on every Pod (an engine or provider connection). Outbound and inbound campaigns show different metrics, covered below.
Open a campaign's analytics
- In your Pod, open Campaigns and click the campaign.
- Open the Analytics tab.
- Set the filters at the top of the tab:
- Date range: defaults to the last 30 days. Pick a start and end date to change it.
- Timezone: defaults to your browser's timezone (or UTC if it can't be detected). Days and hours in the charts are counted in this timezone, so pick your client's timezone when you share numbers with them.
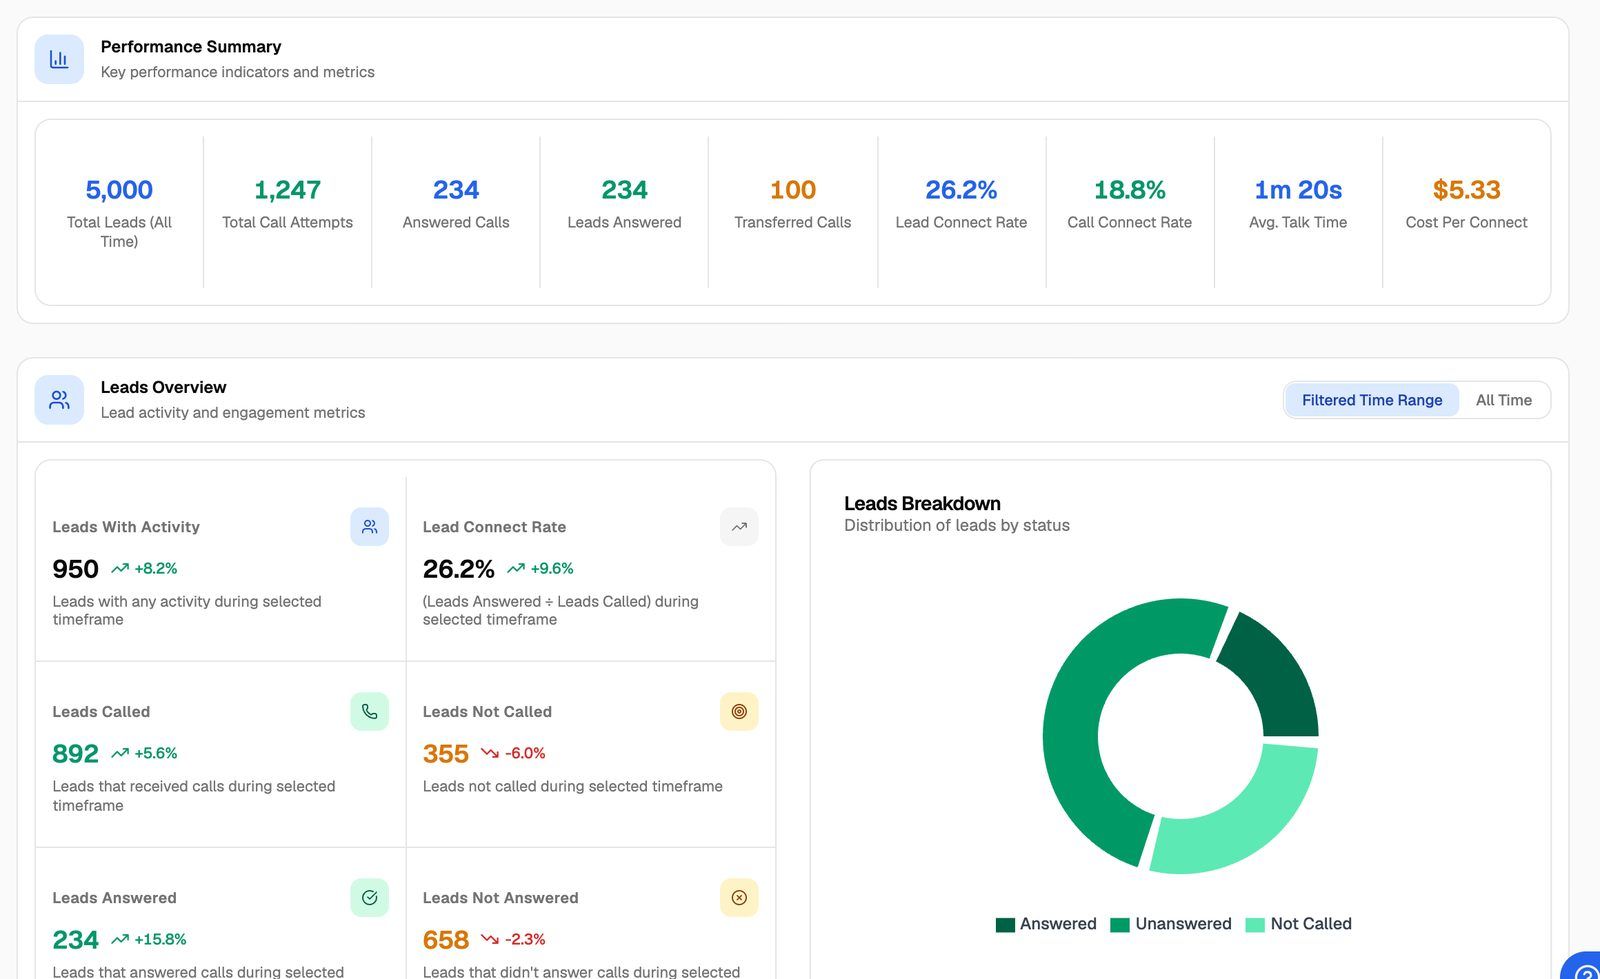
Most metric cards also show a percentage change with an up or down arrow. It compares the selected date range with the period of the same length just before it.
Outbound campaign metrics
The tab is split into sections, from top to bottom.
Performance Summary is a one-line overview: Total Leads (All Time), Total Call Attempts, Answered Calls, Leads Answered, Lead Connect Rate, Call Connect Rate, Avg. Talk Time and Cost Per Connect. Vapi and Retell AI campaigns also show Transferred Calls. Ultravox campaigns don't show Cost Per Connect.
Leads Overview counts leads, not calls. Use the toggle to switch between:
- Filtered Time Range: Leads With Activity, Lead Connect Rate, Leads Called, Leads Not Called, Leads Answered and Leads Not Answered for the selected dates.
- All Time: Total Leads, Lead Connect Rate, Leads Called, Leads Not Called, Leads Answered and Leads Not Answered since the campaign started, ignoring the date range.
Next to these you'll see the Leads Breakdown chart (Answered, Unanswered, Not Called) and, when there's data, Leads Added Per Day and New Leads Called Per Day.
Calls Overview counts every call attempt: Total Call Attempts, Call Connect Rate, Answered Calls and Unanswered Calls, plus the Call Attempts Breakdown chart.
Talk Time Breakdown shows Total Talk Time, Total Voicemail Time, Average Talk Time and Longest Call, with a Talk Time per Day chart. ElevenLabs campaigns show Shortest Call instead of Total Voicemail Time.
Lead connect rate vs call connect rate
A low call connect rate with a healthy lead connect rate usually means your retries are working: people answer on the second or third attempt.
Inbound campaign metrics
Performance Summary shows Total Incoming Calls, New Leads Captured, Avg. Call Duration, Repeat Callers, Cost Per Call and Total Leads (All Time).
Calls & Leads Overview shows:
When there's data, the New Leads Captured Per Day chart appears below. Call Duration Breakdown shows Total Talk Time, Average Call Duration, Longest Call and Shortest Call, and Talk Time Breakdown charts talk time by date.
Cost metrics (only visible to you)
The Cost Analysis section shows what the campaign cost on your Pod. It's marked Only visible to you: your clients never see these numbers. They see their own charges in their billing section instead.
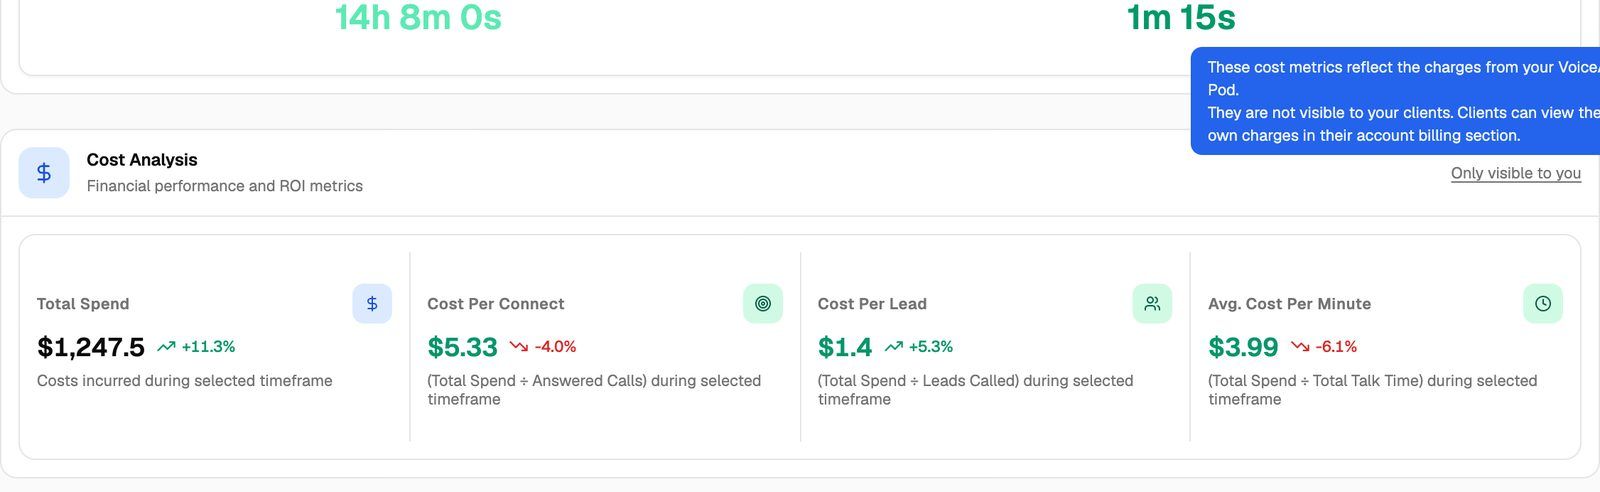
The unit depends on the Pod:
- VAW Native: AI credits ("Credits").
- ElevenLabs: ElevenLabs tokens ("Tokens").
- Vapi, Retell AI and Bolna: US dollars ($), reflecting the charges on your own provider account.
- Ultravox: campaigns don't show the Cost Analysis section.
Use Cost Per Connect or Avg. Cost Per Minute as your baseline when you set client prices, then add your margin. See Choose a Pricing Model.
Calls Breakdown charts
The last section holds the detailed charts, for both outbound and inbound campaigns:
- Calls Distribution by Day: call volume over the date range.
- Call Distribution by Calling Window: a heatmap of calls by day of the week and hour, in the selected timezone. Use it to see when people actually pick up, then adjust your calling window.
- Call End Reasons: how calls ended. Not shown for Bolna campaigns.
- Call Success Evaluation: how calls scored against your success metric. It only appears when there's success data for the date range. See Define a Campaign Success Metric.
Reading the Call End Reasons chart
Each bar is one end reason, sorted from most to least common. Hover a bar to see the number of calls and their share of the total. Under the chart, the six most common reasons are listed with their counts and percentages. Calls the provider ended without a reason are grouped as No Reason.
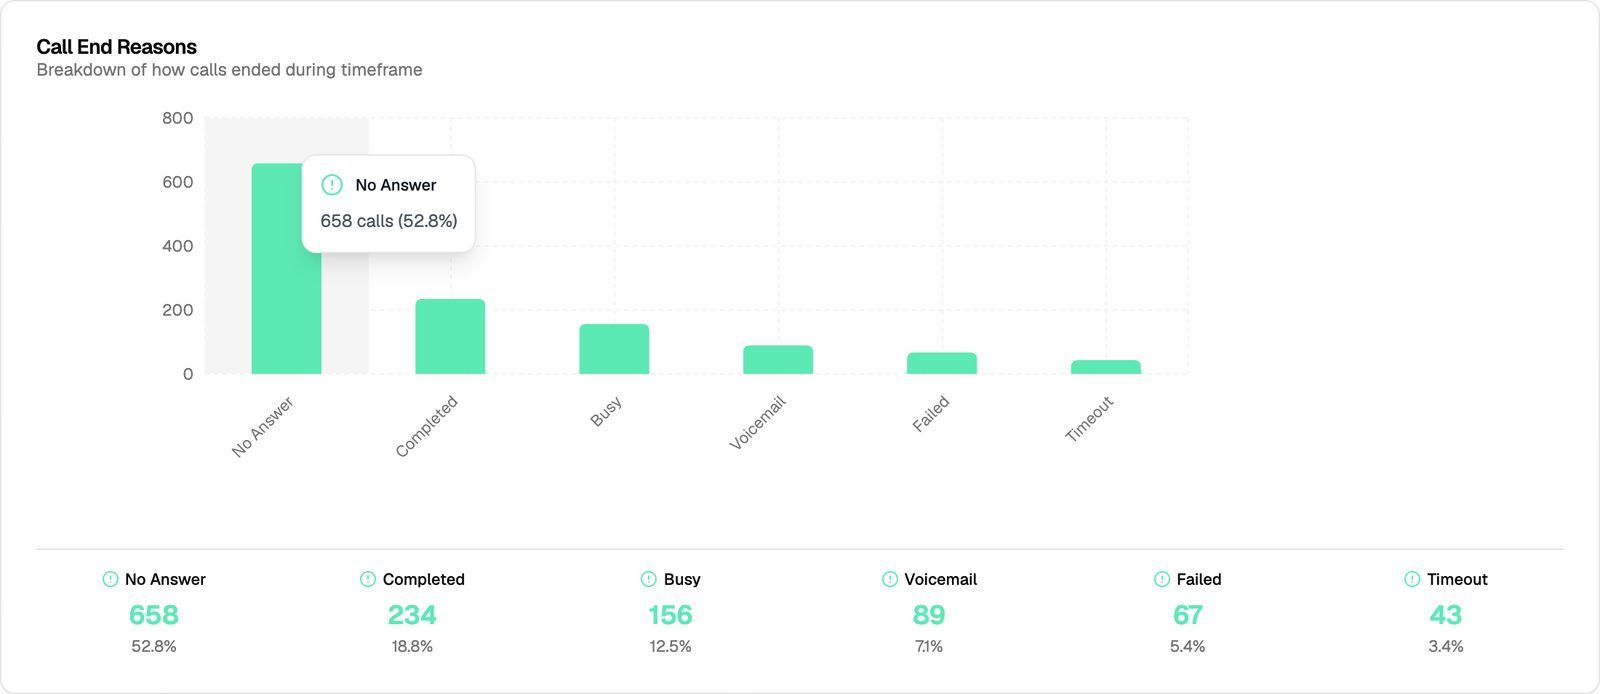
The reason names come from your engine or provider. For what each one means, see Call Statuses and End Reasons.
Frequently asked questions
Why do the numbers here differ from the Overview tab?
Why do the numbers here differ from the Overview tab?
Analytics counts activity inside the date range you pick (and in the timezone you pick), except metrics marked All Time. Other screens, such as the Overview tab, aren't tied to this date range. Widen the date range to cover the whole campaign, or use the All Time toggle in Leads Overview, to compare like with like. See Campaign Overview: Lead Health, Live Calls and Next in Line.
The charts are empty.
The charts are empty.
Check the date range and timezone. Charts only include calls inside the selected dates, counted in the selected timezone. A brand-new campaign with no calls yet shows zeros.
Can my clients see these analytics?
Can my clients see these analytics?
Clients see an Analytics tab on the campaign in their portal when their workspace permissions allow it. Their version never includes the Cost Analysis section or cost cards. See Set Client Permissions on Vapi, Retell and ElevenLabs Workspaces or Set Client Permissions on VAW Native Workspaces.
The tab shows "Error:" followed by a message.
The tab shows "Error:" followed by a message.
The analytics couldn't load. Refresh the page. If it keeps happening, open Need help? → Help Chat and include the campaign name and the error text.
Related articles
Was this helpful?
Still need help? Share an idea