Show a Client Dashboard to Your Clients
Choose which client workspaces see a client dashboard as their Dashboard page, and what your clients see once it's live.
Written By voiceaiwrapper
Last updated 26 days ago
A new client dashboard isn't shown to anyone until you choose the client workspaces that should see it. Once you do, those clients see your dashboard in place of their standard Dashboard page. You can show one dashboard in many workspaces, and switch a workspace back to the standard page at any time.
Available on: plans that include Client dashboards. If your plan stops including it, your clients go back to their standard Dashboard page.
Before you start
- Build and save the dashboard. See Build a Client Dashboard.
- The workspace must be on the same Pod (an engine or provider connection) as the dashboard. Only those workspaces are listed.
- The client needs the Dashboard page. If a workspace's access settings turn the Dashboard page off, the client won't see any dashboard. See Set Client Permissions on VAW Native Workspaces or Set Client Permissions on Vapi, Retell and ElevenLabs Workspaces.
Option 1: From the dashboard
Use this to show one dashboard in several workspaces at once.
- Open the dashboard from Client Dashboards under your Pod.
- Click Show in client workspaces.
- Tick the workspaces that should see it. Use the search box to find a client or workspace, or Select all.
- Click Show in N client workspaces (the button counts your ticks). If you untick every workspace, the button says Save.
Each row tells you what that workspace shows today: Shows this dashboard, the name of another dashboard, or Standard Dashboard page. A workspace with its Dashboard page turned off is marked "The client's Dashboard page is turned off, so they won't see it".
If some workspaces already show another dashboard, you're asked to confirm. Click Switch them to move them to this one.
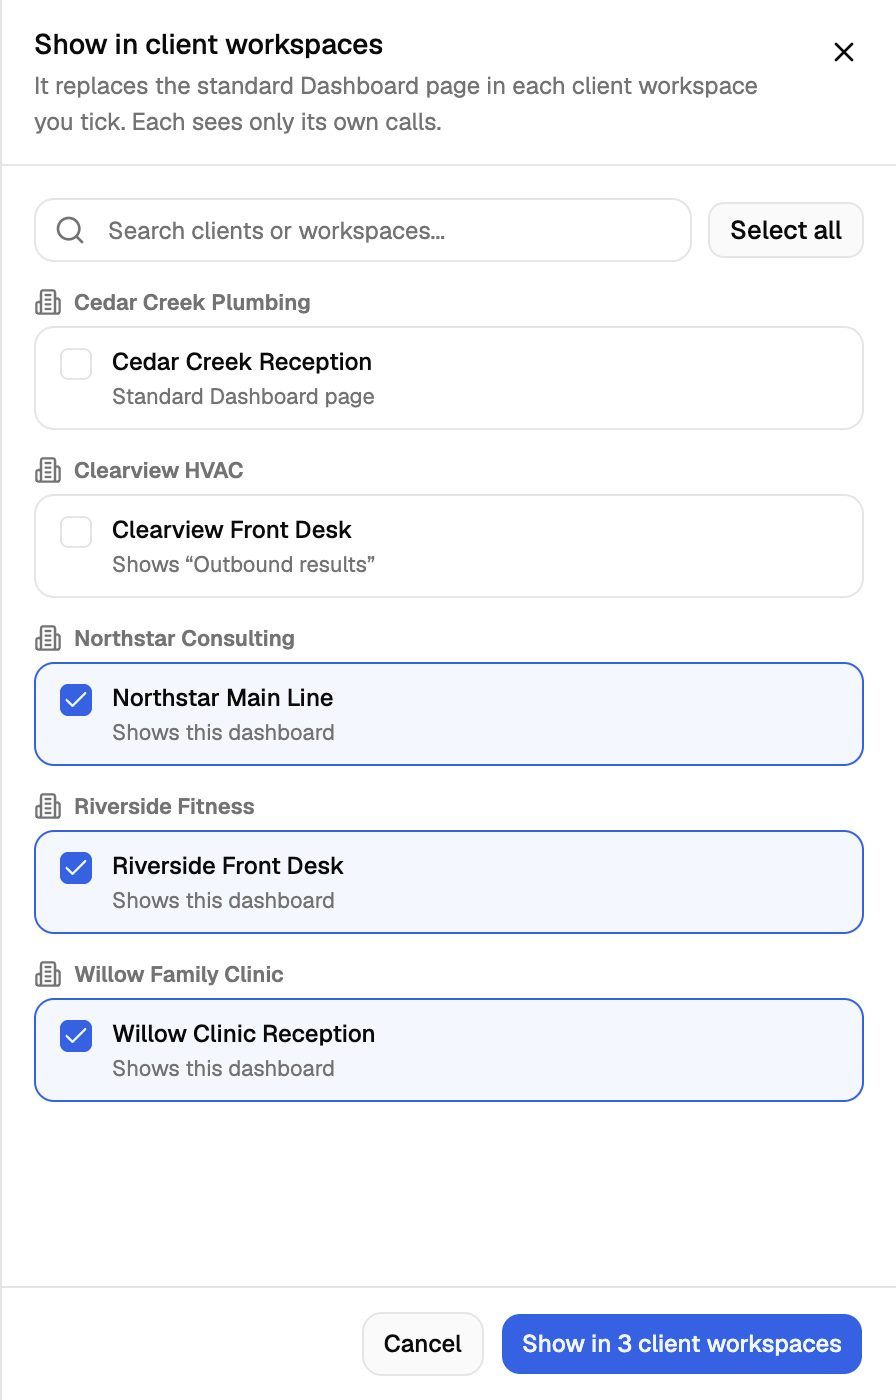
To stop showing the dashboard in a workspace, untick it. That workspace goes back to the standard Dashboard page.
Option 2: From the workspace setup
Use this when you're setting up or editing one client's workspace.
- Open Client Accounts, then the client, then the Workspaces tab.
- Next to the workspace, click Update → Access. (For a new workspace, click Add Workspace and go to the Access Control step.)
- Open the Dashboard section.
- Under Client dashboard, choose one of the Pod's dashboards, or Standard Dashboard page.
- Click Next to the Review step and save the workspace.
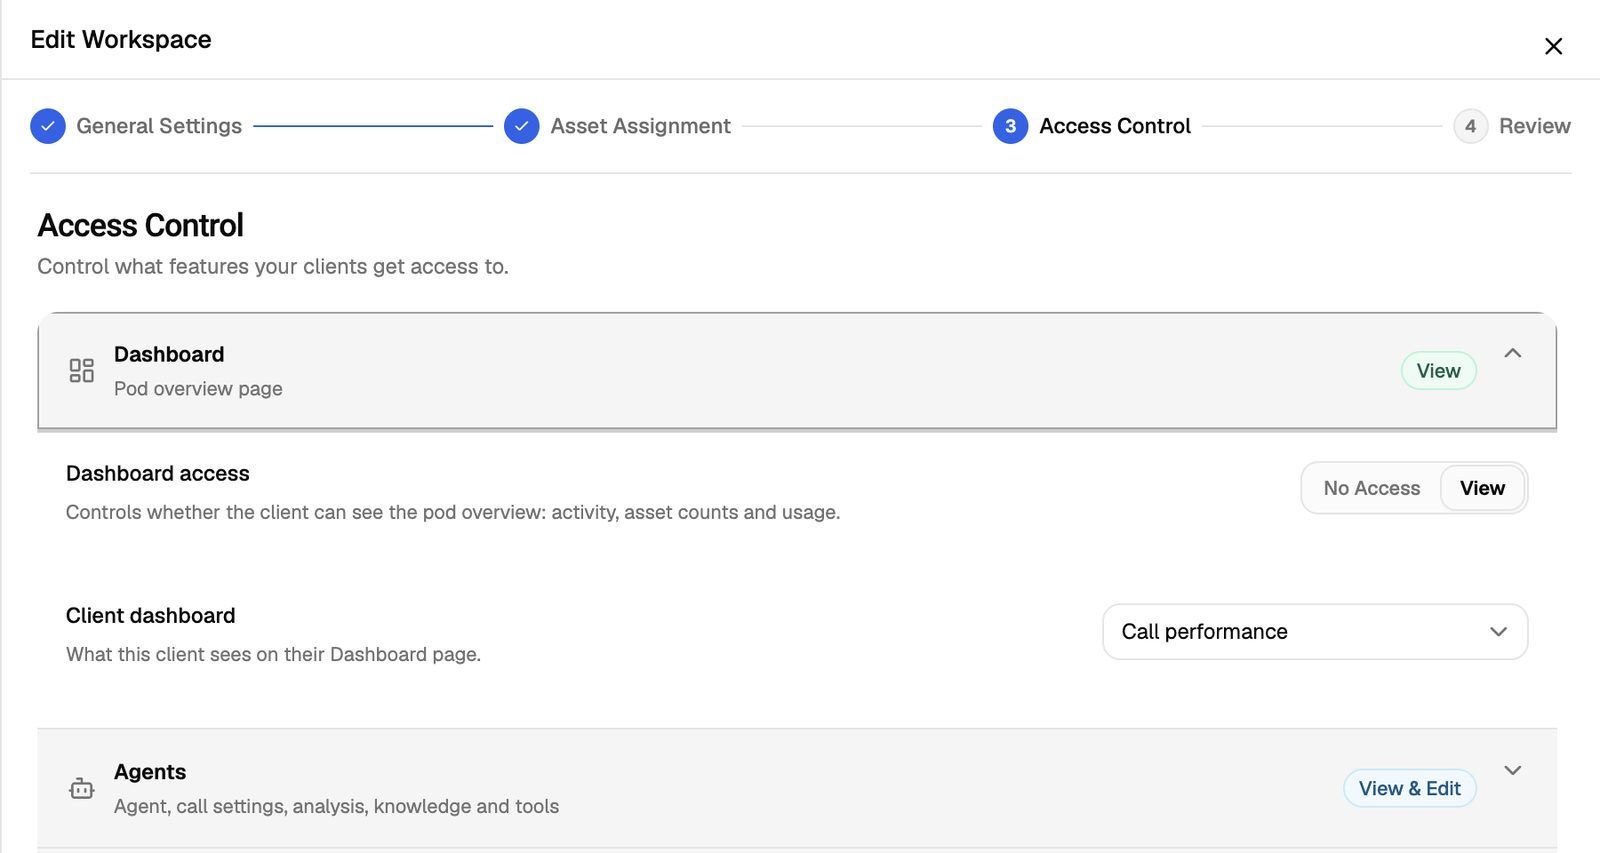
The choice also shows on the Review step. If the Pod has no dashboards yet, the field says "This pod has no client dashboards yet. Build one in Client Dashboards." If you change the workspace's Pod, its dashboard resets to the standard page.
Rules to know
- A workspace shows one dashboard at most. One dashboard can be shown in any number of workspaces on its Pod.
- If anything stops a dashboard loading, or it's deleted, the client sees the standard Dashboard page instead.
- The dashboard's name is only for your team. Clients always see the page as Dashboard.
What your clients see
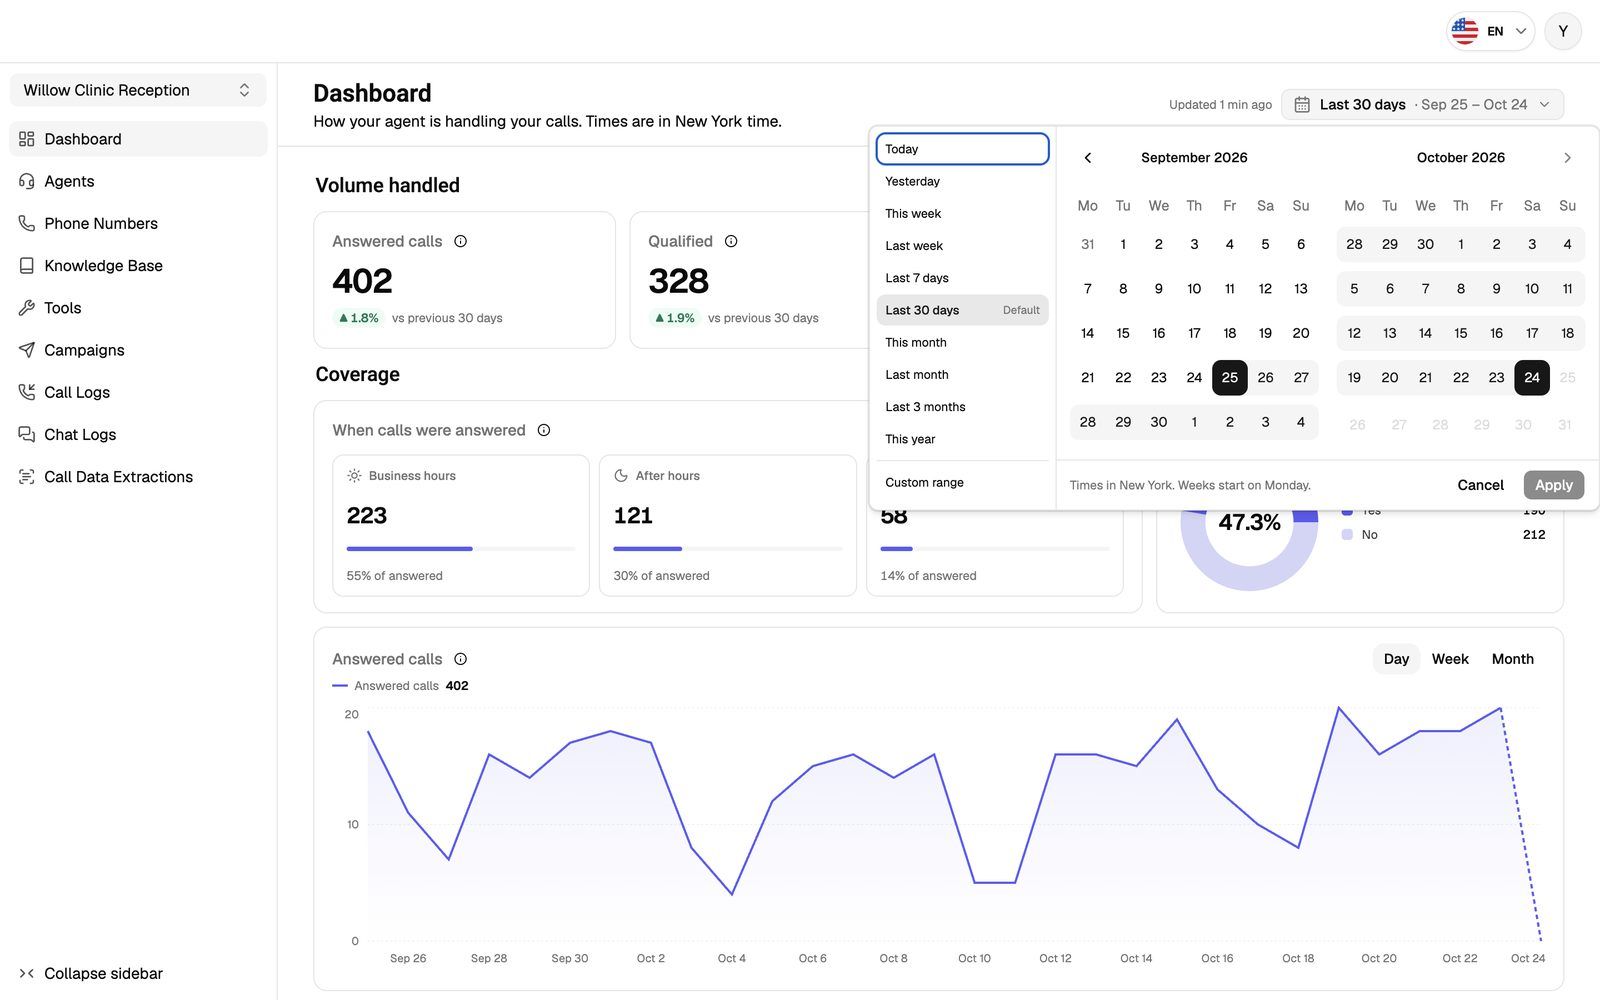
- The Dashboard page with your tiles, in your branding and the client's portal language. Tiles that can't be shown to them (for example a tile their engine can't supply) are left out, and the rest close up.
- A line under the title saying the times are in the dashboard's timezone, for example "Times are in London time."
- An "Updated" line, such as "Updated 2 min ago". Numbers for periods that include today refresh about every 2 minutes; periods that have ended are kept for up to 6 hours.
- A period picker, if you left Let clients change the period on: Today, Yesterday, This week, Last week, Last 7 days, Last 30 days, This month, Last month, Last 3 months, This year or Custom range. Custom ranges go up to 12 months, and comparisons only show for periods up to 3 months. If you turned it off, the picker says "This dashboard always shows this period."
- On a phone, the tiles stack in one column.
Before the workspace's first call, the page says "Numbers appear here after your agent's first call."
To check the result, log in as the client. See Log In as a Client to Preview Their Portal.
Troubleshooting
My client still sees the standard Dashboard page.
My client still sees the standard Dashboard page.
Check that:
- the workspace is ticked in Show in client workspaces, or chosen under Client dashboard in the workspace setup
- the workspace is on the same Pod as the dashboard
- the workspace's Dashboard page isn't turned off in its access settings
- your plan still includes Client dashboards
A workspace isn't in the list.
A workspace isn't in the list.
Only workspaces on the dashboard's Pod are listed. Open the dashboard under the workspace's own Pod, or copy the dashboard there with Copy to another pod.
My client says a tile is missing.
My client says a tile is missing.
Tiles their engine can't supply, field tiles with no fields picked, and the Plan usage or Agent builder tiles for clients they don't apply to are all left out. See Client Dashboard Tiles and Fields.
Related articles
Was this helpful?
Still need help? Share an idea