Build a Client Dashboard
Design a dashboard of call results for a Pod, from a template or from scratch, to show clients in place of their standard Dashboard page.
Written By voiceaiwrapper
Last updated 26 days ago
A client dashboard replaces a client's standard Dashboard page with one you design. You choose the numbers and charts that matter to that client (calls answered, hours your agents worked, qualified leads, how calls ended) and lay them out on a grid. Clients see it read-only, with your branding, as their Dashboard.
Each dashboard belongs to one Pod (an engine or provider connection) and reads that Pod's calls. You build it once and can show it to as many client workspaces on that Pod as you like.
Available on: plans that include Client dashboards. Without it, the page says "Client dashboards aren't on your plan. Your clients see their standard Dashboard page." and creating, duplicating or showing a dashboard opens an upgrade prompt.
Applies to: VAW Native, Vapi, Retell AI and ElevenLabs Pods. Bolna and Ultravox Pods don't have client dashboards.
Before you start
- Have at least one client workspace on the Pod, ideally with some calls. The editor previews the dashboard with a real workspace's calls; without one, tiles have no numbers to show. See Create a Workspace and Assign Assets.
- Use a wide screen. The editor needs a window at least 1024 pixels wide. On a smaller screen it says "Client dashboards are edited on a wider screen".
- Set up your agents' fields if you want tiles such as "Qualified leads". Those come from your agents' post-call results. See Client Dashboard Tiles and Fields.
Step 1: Open Client dashboards
- In the sidebar, under your Pod's name, click Client Dashboards.
- The list shows each dashboard for this Pod, how many tiles it has (and how many are hidden from clients, for example tiles the engine can't supply or field tiles with no fields picked), and how many client workspaces it's Shown in.
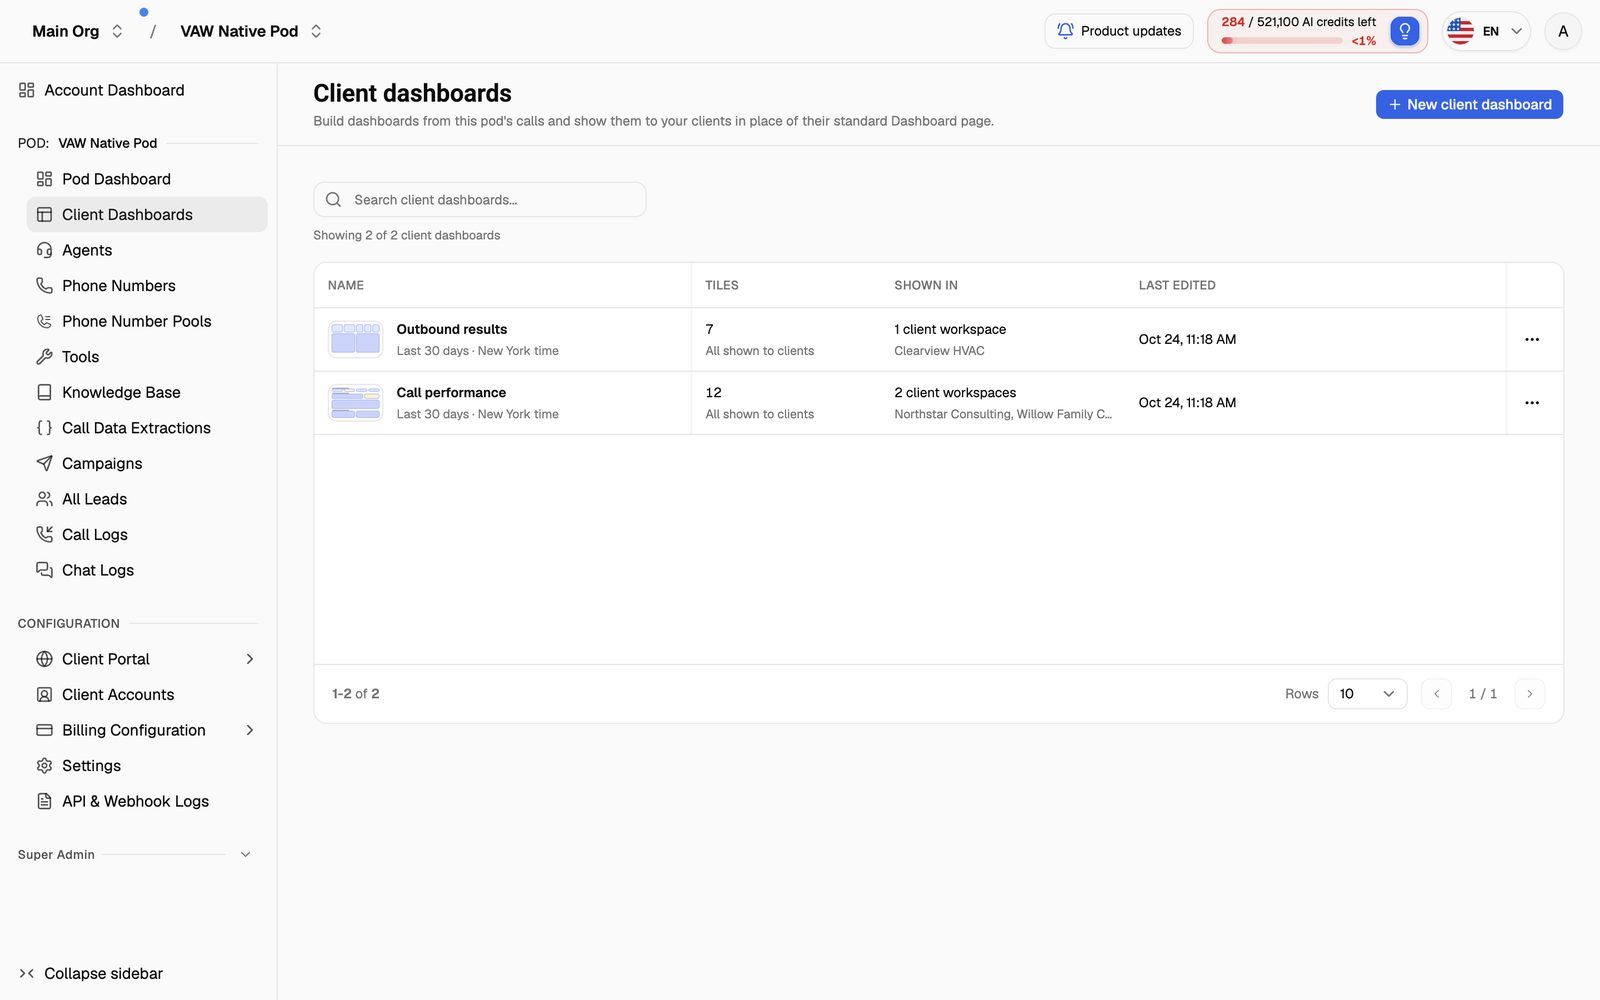
Use the ⋯ menu on a row to Open, Duplicate, Copy to another pod or Delete client dashboard.
Step 2: Create a dashboard
- Click New client dashboard.
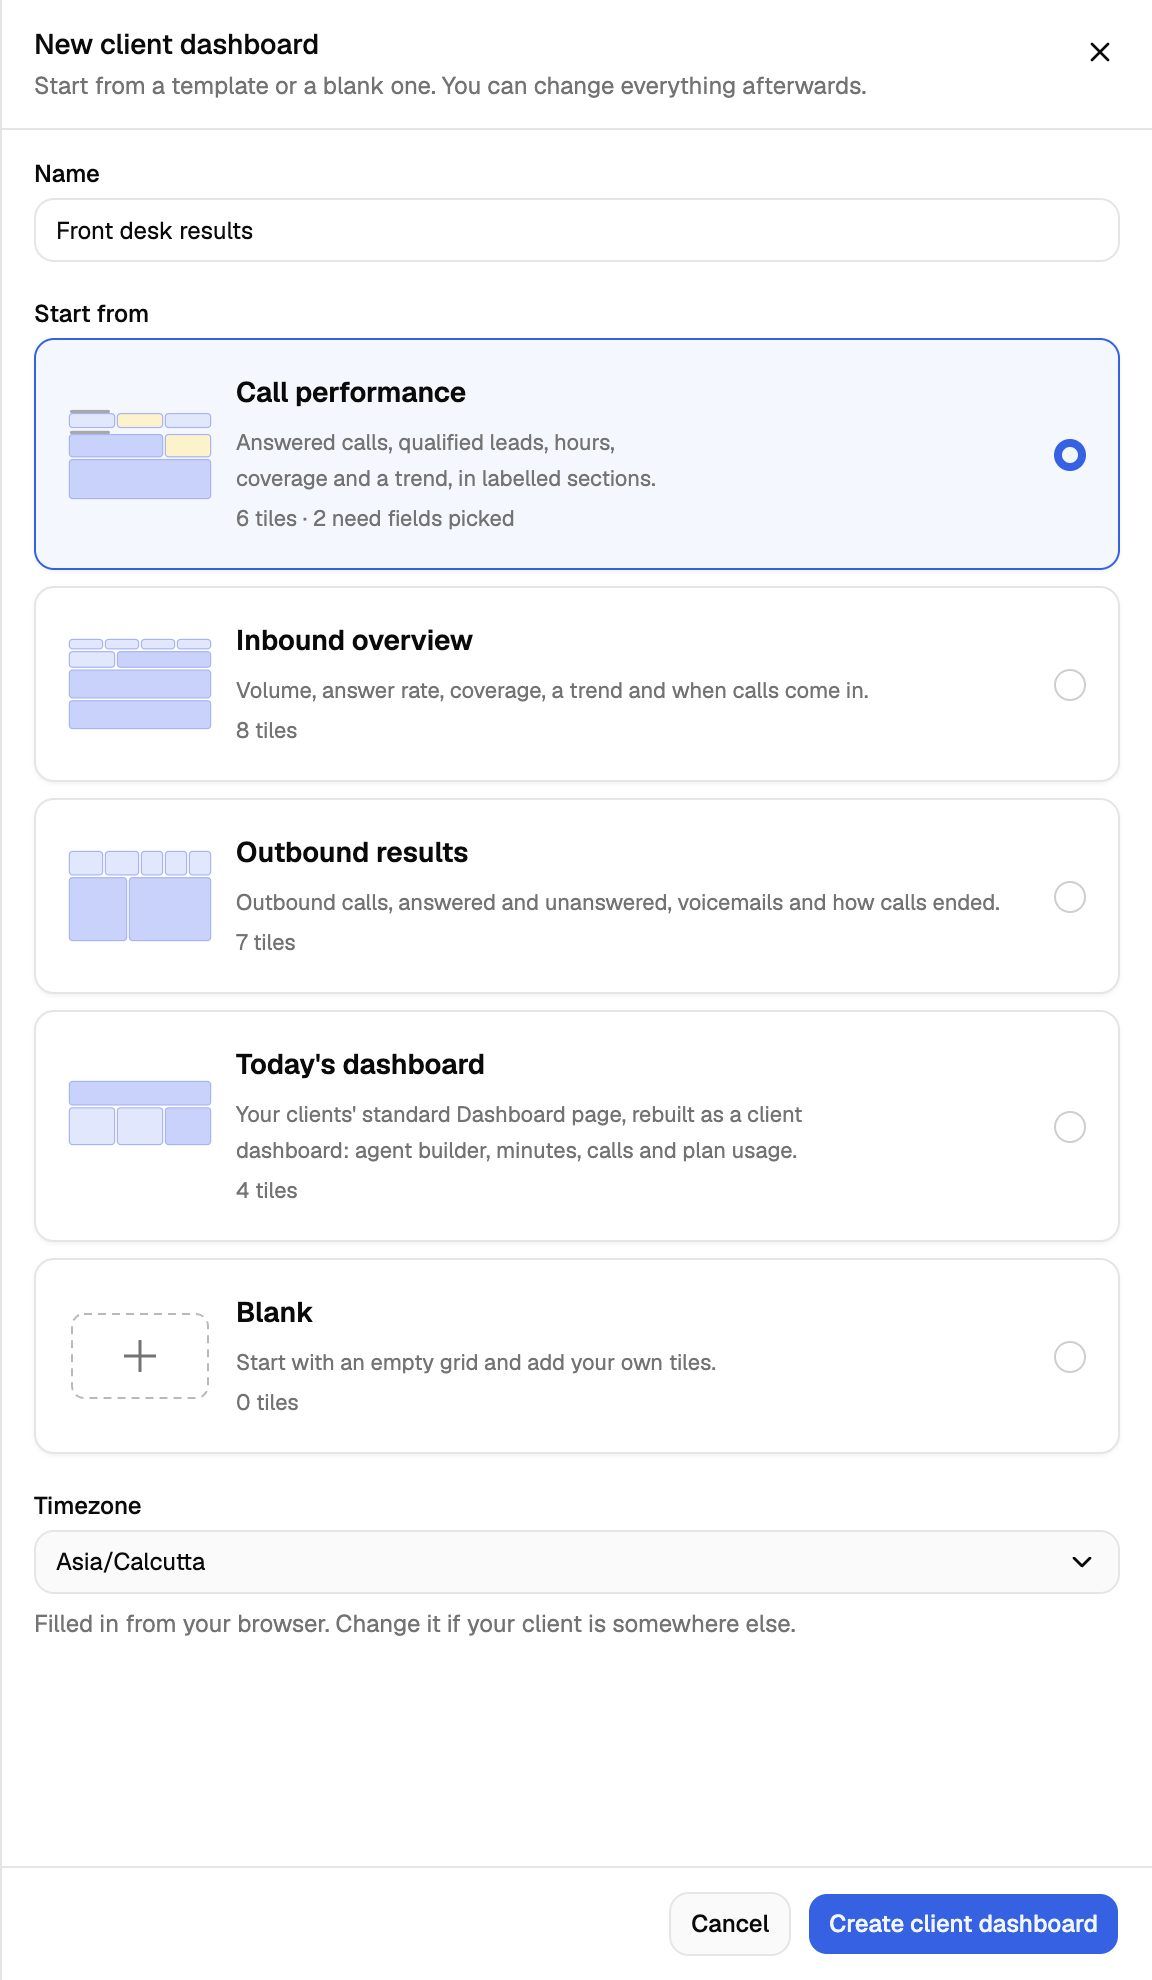
- Enter a Name. Only your team sees it; clients always see the page as Dashboard. Names must be unique within the Pod.
- Under Start from, pick a template:
- Check the Timezone. It's filled in from your browser; change it if your client is somewhere else. Periods, business hours and charts all use this timezone, whoever is looking.
- Click Create client dashboard. The editor opens.
Step 3: Lay out your tiles
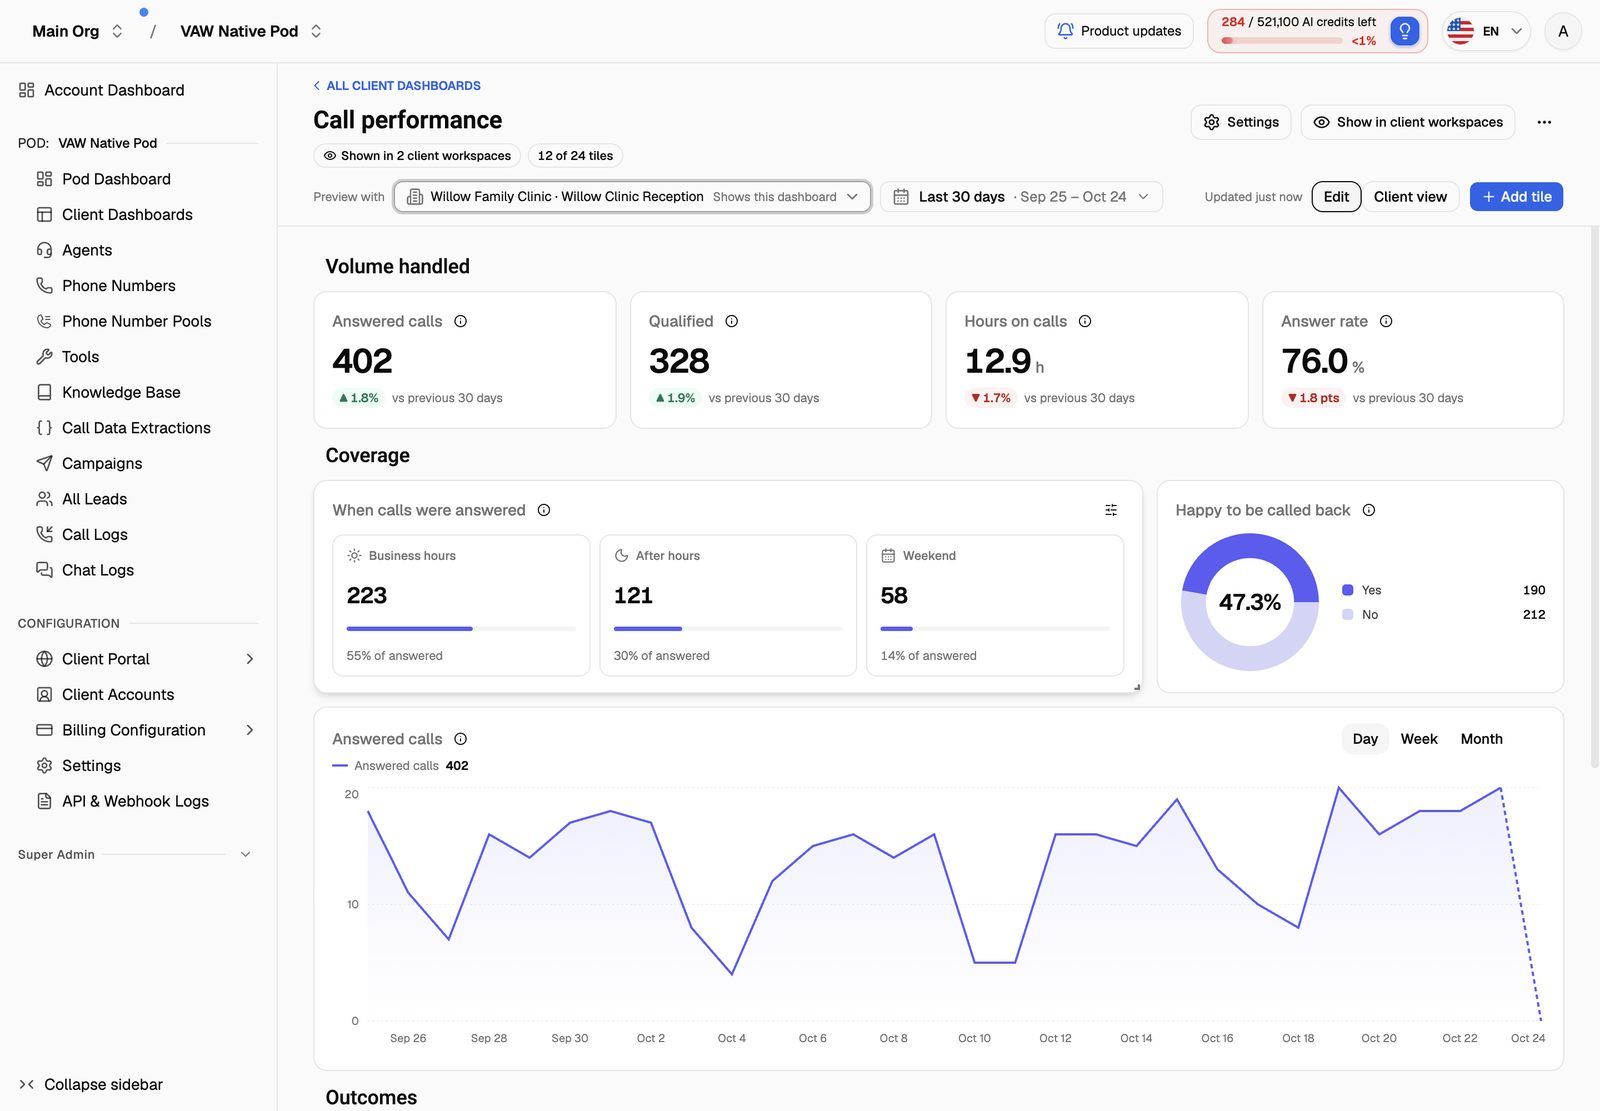
- Add a tile: click Add tile and pick one from Call numbers, From your agents' fields or Layout and other. Each tile type is described in Client Dashboard Tiles and Fields.
- Move and resize: drag a tile to move it, and drag its corner to resize it. With the keyboard, select a tile and use the arrow keys to move it and Shift + arrow keys to resize it.
- Change a tile: click it (or press Enter) to open its settings: what it counts, how it's shown, and More options such as comparisons and targets.
- Remove a tile: select it and press Delete, or click Remove tile in its settings. An Undo message appears for a moment.
- Copy a tile: click Duplicate in its settings.
- Group tiles: add a Section heading tile to split the dashboard into parts.
A dashboard holds up to 24 tiles.
Preview with real calls
Use Preview with to pick one of your client workspaces on this Pod. The tiles then show that workspace's real numbers for the selected period. Switch to Client view to see exactly what clients will see: hidden tiles removed and no editing.
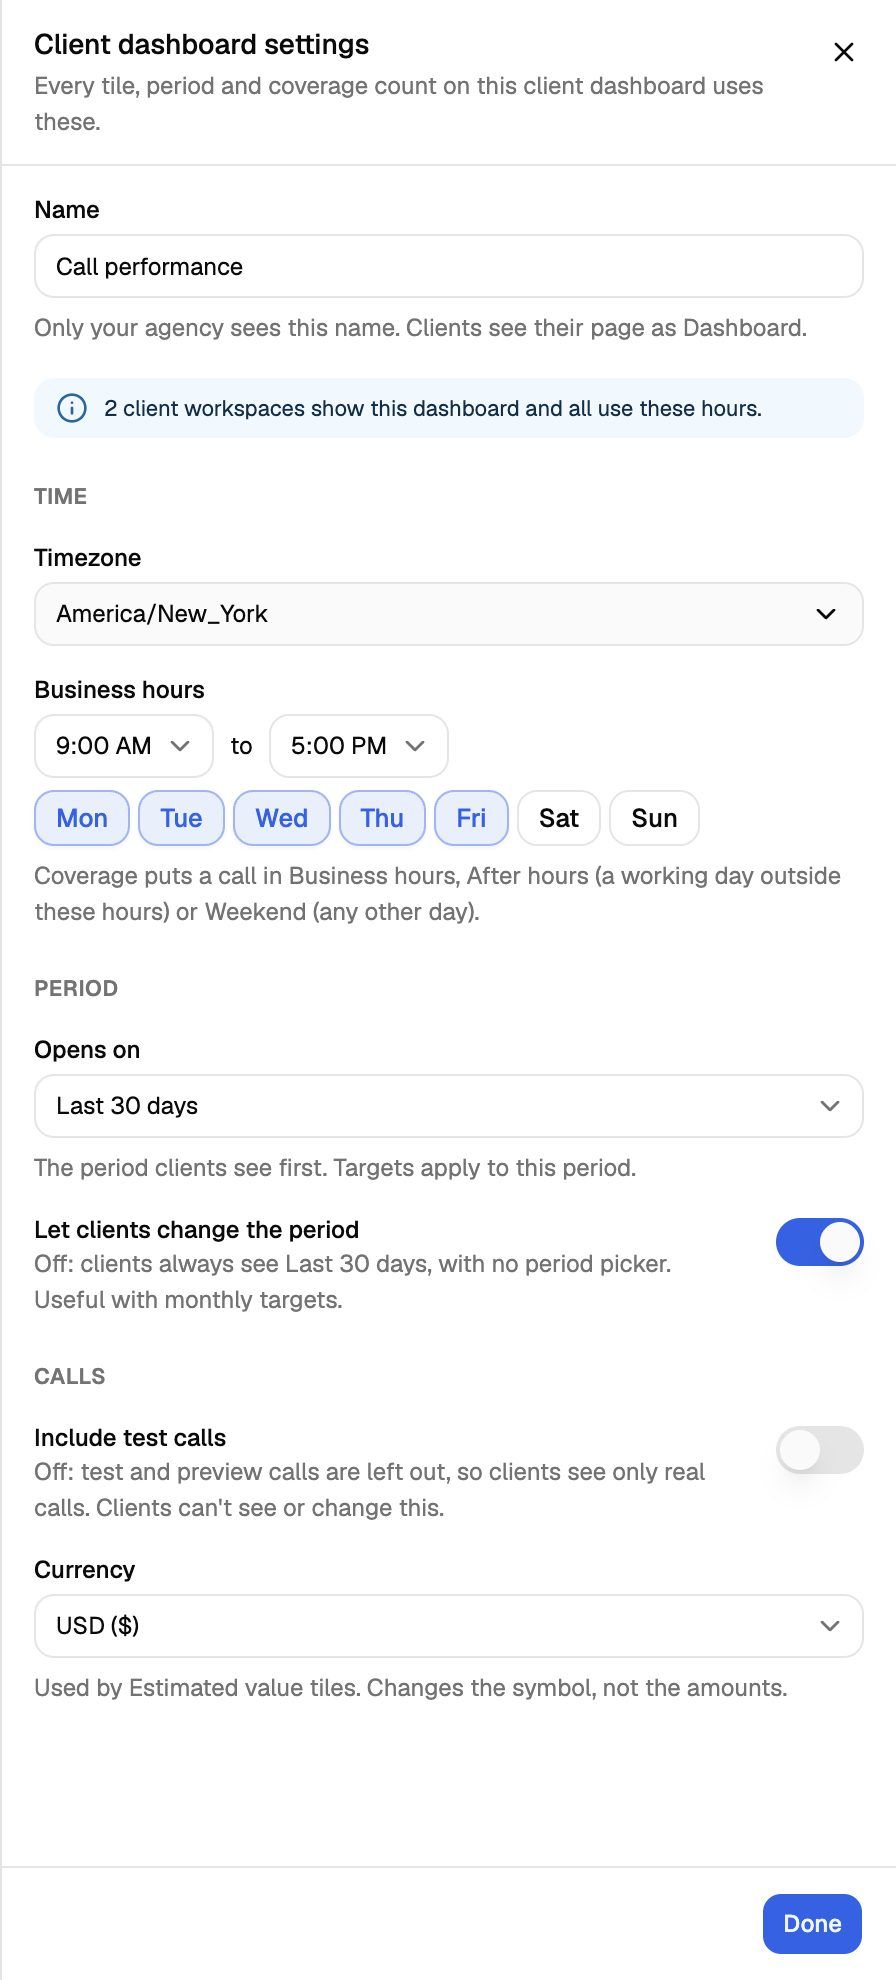
Step 4: Adjust the dashboard settings
Click Settings at the top of the editor.
Step 5: Save
Changes aren't live until you save. While you have unsaved changes, a bar reads "Unsaved changes · Clients see the last saved version", with Discard and Save.
If you try to leave the editor with unsaved changes, you'll be asked to Keep editing, Discard changes or Save and leave. The browser's back button skips this prompt, so save first.
Clients see the saved version the next time their Dashboard page loads.
Next: show it to your clients
A new dashboard isn't shown to anyone. See Show a Client Dashboard to Your Clients.
Duplicate, copy or delete a dashboard
- Duplicate makes a copy on the same Pod, named "(copy)". The copy isn't shown to any client workspace.
- Copy to another pod copies the settings and every tile to another Pod. Tiles based on your agents' fields lose their fields, because each Pod's agents have their own, so pick them again. Tiles the other engine can't supply are hidden from clients.
- Delete client dashboard removes it for good. Client workspaces that showed it go back to the standard Dashboard page.
Deleting a client dashboard can't be undone. If it's shown in client workspaces, their Dashboard pages switch back to the standard page straight away.
Troubleshooting
The tiles show no numbers.
The tiles show no numbers.
Pick a client workspace in Preview with. If the workspace has never had a call, its tiles stay empty until the first one. Also check the period: a short period such as Today may have no calls yet.
I don't see Client Dashboards in the sidebar.
I don't see Client Dashboards in the sidebar.
Client dashboards are listed under a Pod, so open the Pod first. Bolna and Ultravox Pods don't have them. If the item is greyed out, connect the Pod first.
I saved, but my client still sees the old version.
I saved, but my client still sees the old version.
Results are kept for a short time to keep the page fast: about 2 minutes for periods that include today, and up to 6 hours for periods that have ended. Your layout changes show on the client's next page load; the numbers refresh on that schedule.
Related articles
Was this helpful?
Still need help? Share an idea