Your Portal Dashboard
Read your call totals, billing usage and campaign analytics on the portal dashboard, and what you see when the dashboard is turned off.
Written By voiceaiwrapper
Last updated 26 days ago
The dashboard is your portal's home page. It shows how many calls your agents have handled, how much of your plan you've used this billing period, and how each campaign is performing. Your provider decides whether you see it, so your portal may open on a different page.
Open the dashboard
Click Dashboard in the sidebar. The page is titled Dashboard with the line "Overview of your account and campaigns". It's also where the portal takes you after you log in or switch workspace.
From top to bottom, you'll see:
- An agent builder banner, if your provider has turned it on.
- Account Stats: your call and billing totals.
- Campaign Analytics: results for one campaign at a time.
If your dashboard looks different
Your provider can design a dashboard for you. If they have, the Dashboard page shows their tiles instead of the sections below, with the line "How your agent is handling your calls" and the timezone the times are shown in.
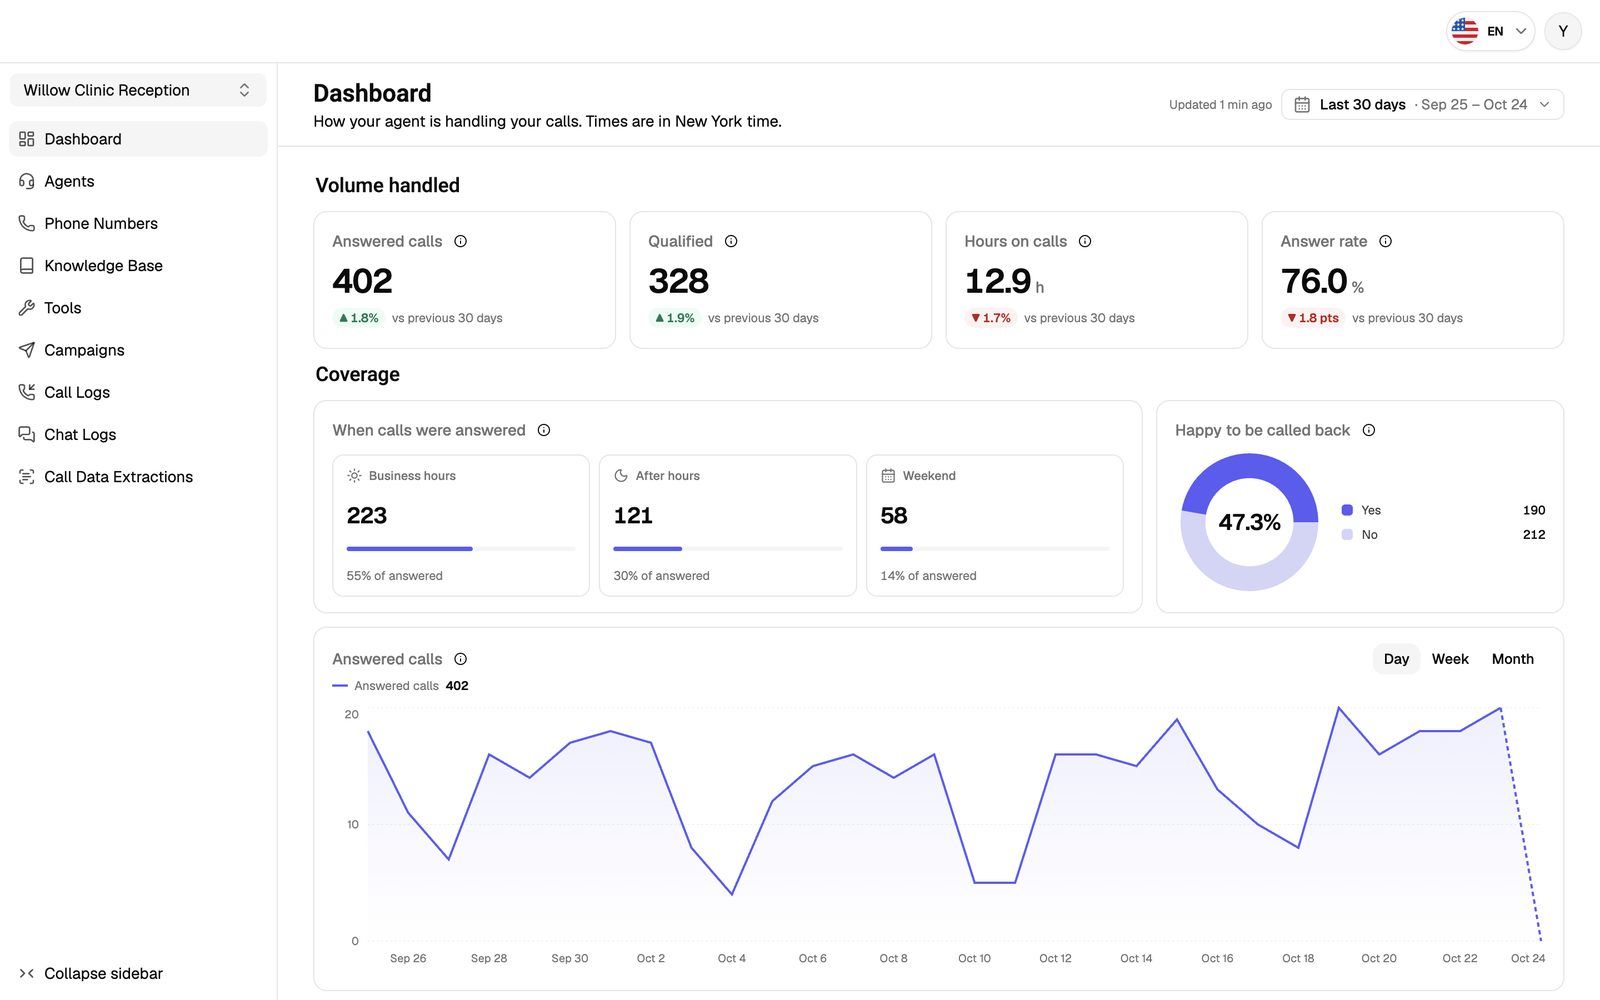
- Updated at the top says how fresh the numbers are. Numbers for periods that include today refresh every couple of minutes.
- Choose a period with the period picker: Today, Yesterday, This week, Last 7 days, Last 30 days, This month, Last 3 months, This year, a Custom range of up to 12 months, and more. If the picker says "This dashboard always shows this period", your provider has fixed the period.
- Comparisons with the previous period show for periods up to 3 months.
- Coverage tiles split your calls into business hours, after hours and weekend. Click one to show only those calls across the dashboard, and Show all calls to go back.
- Before your first call, the page says "Numbers appear here after your agent's first call."
If you'd like different numbers on your dashboard, ask your provider.
Agent builder banner
If your provider lets you build agents with the AI agent builder, a banner at the top says Build a ready-to-call agent with followed by the builder's name. Click Create agent (or Create assistant) to start. See Manage Your Agents for how the builder works.
Account Stats
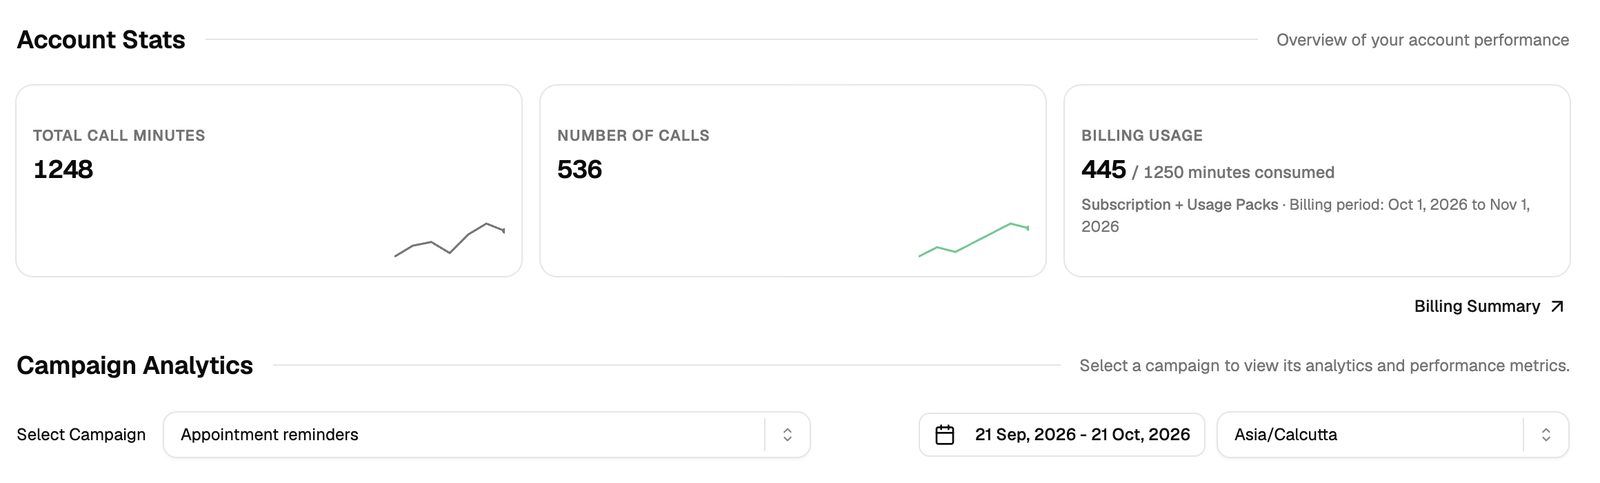
Total Call Minutes and Number of Calls cover your whole account, across all your workspaces. They count the calls made through your campaigns and, in some workspaces, calls your agents take outside a campaign. The small line on each card shows the daily trend.
Billing Usage
The Billing Usage card appears when you have a subscription billed through the portal. Under the number you'll see your plan type and a line such as Billing period: Oct 1, 2026 to Oct 31, 2026.
Click Billing Summary below the cards to open the Billing page with your plan details. The link only appears together with the Billing Usage card. See Billing, Trials and Usage Packs in Your Portal.
Campaign Analytics
This section appears if you can see campaigns in this workspace. It shows results for one campaign at a time.
- Next to Select Campaign, pick a campaign. The first campaign is selected when the page opens, and you can type to search the list.
- Use the date range picker to choose the period. It starts at the last 30 days.
- Use the timezone selector to choose the timezone for dates and times. It starts at your browser's timezone (or UTC if that one isn't in the list).
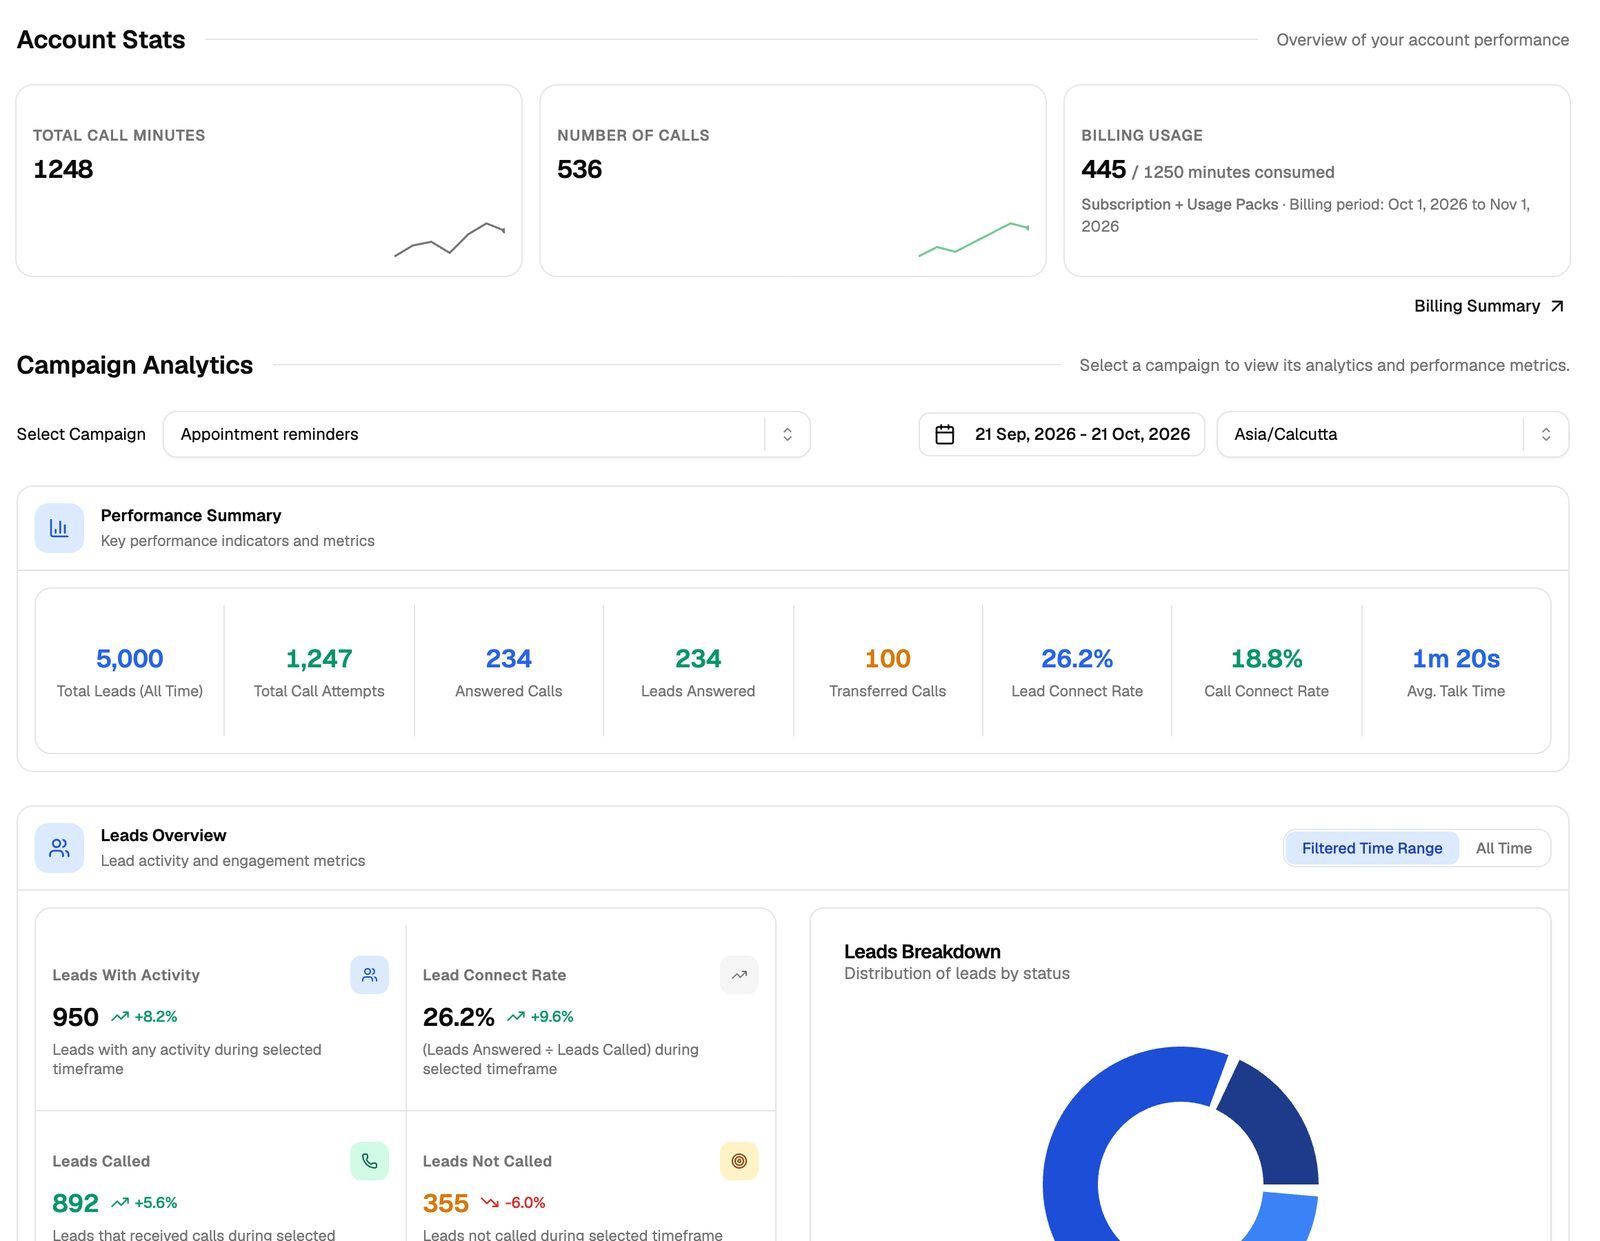
What you see depends on the campaign type.
A few things to know when reading the numbers:
- Most figures follow the date range. Ones marked All Time, such as Total Leads (All Time), ignore it.
- Leads Overview (outbound) has a switch between Filtered Time Range and All Time.
- Up and down percentages compare the selected period with the period of the same length just before it.
- Rates are worked out like this: Lead Connect Rate is leads answered ÷ leads called, and Call Connect Rate is answered calls ÷ total call attempts.
- Talk Time Breakdown charts talk time by date. Calls Breakdown holds the other charts: calls per day, a day-and-hour heatmap of when calls happen and, depending on the campaign, why calls ended and how often they met the success goal.
For the full campaign view, including leads and call recordings, open the campaign from Campaigns. See Run Campaigns and Manage Leads.
If you don't see a dashboard
Your provider can turn the dashboard off. In that case the portal opens on the first of these sections you have: Campaigns, Phone Numbers, Phone Number Pools, Agents (or Assistants), Knowledge Base, Tools, and after those a few others such as Call Logs in some workspaces.
If the portal can't find any of them, you'll see Your account doesn't seem to have the right configurations. Please reach out to our support team. If the sidebar still shows sections such as Call Logs or Billing, you can open them from there. Otherwise contact your provider to set up your access.
Frequently asked questions
Why don't I see the Billing Usage card?
Why don't I see the Billing Usage card?
It only appears for a subscription billed through the portal on one of the four plan types above. If your provider bills you another way, the dashboard shows only Total Call Minutes and Number of Calls. You can still check your plan on the Billing page if it's in your sidebar.
Why don't Account Stats match Campaign Analytics?
Why don't Account Stats match Campaign Analytics?
They measure different things. Account Stats are all-time totals for your whole account across every workspace. Campaign Analytics shows one campaign for the date range you pick.
Campaign Analytics says "No campaigns associated with your account."
Campaign Analytics says "No campaigns associated with your account."
No campaigns have been set up in this workspace yet. If you expect to see one, switch workspace (see Getting Started in Your Portal) or contact your provider.
Can I see call costs here?
Can I see call costs here?
No. The portal's analytics don't show costs. For what you're billed, see the Billing page.
Related articles
Was this helpful?
Still need help? Share an idea