Client Dashboard Tiles and Fields
Every tile you can add to a client dashboard, how each can be shown, and how to build tiles from your agents' post-call fields.
Written By voiceaiwrapper
Last updated 26 days ago
A client dashboard is made of tiles. Each tile shows one number or chart: how many calls were answered, how many hours your agents spent on calls, how many callers booked an appointment. This article lists every tile, how each one can be displayed, and how to build tiles from the fields your agents fill in after each call.
To add a tile, open a dashboard and click Add tile. Search for a tile by name, or scroll through the groups: Call numbers, From your agents' fields and Layout and other. For building and saving a dashboard, see Build a Client Dashboard.
Available on: plans that include Client dashboards.
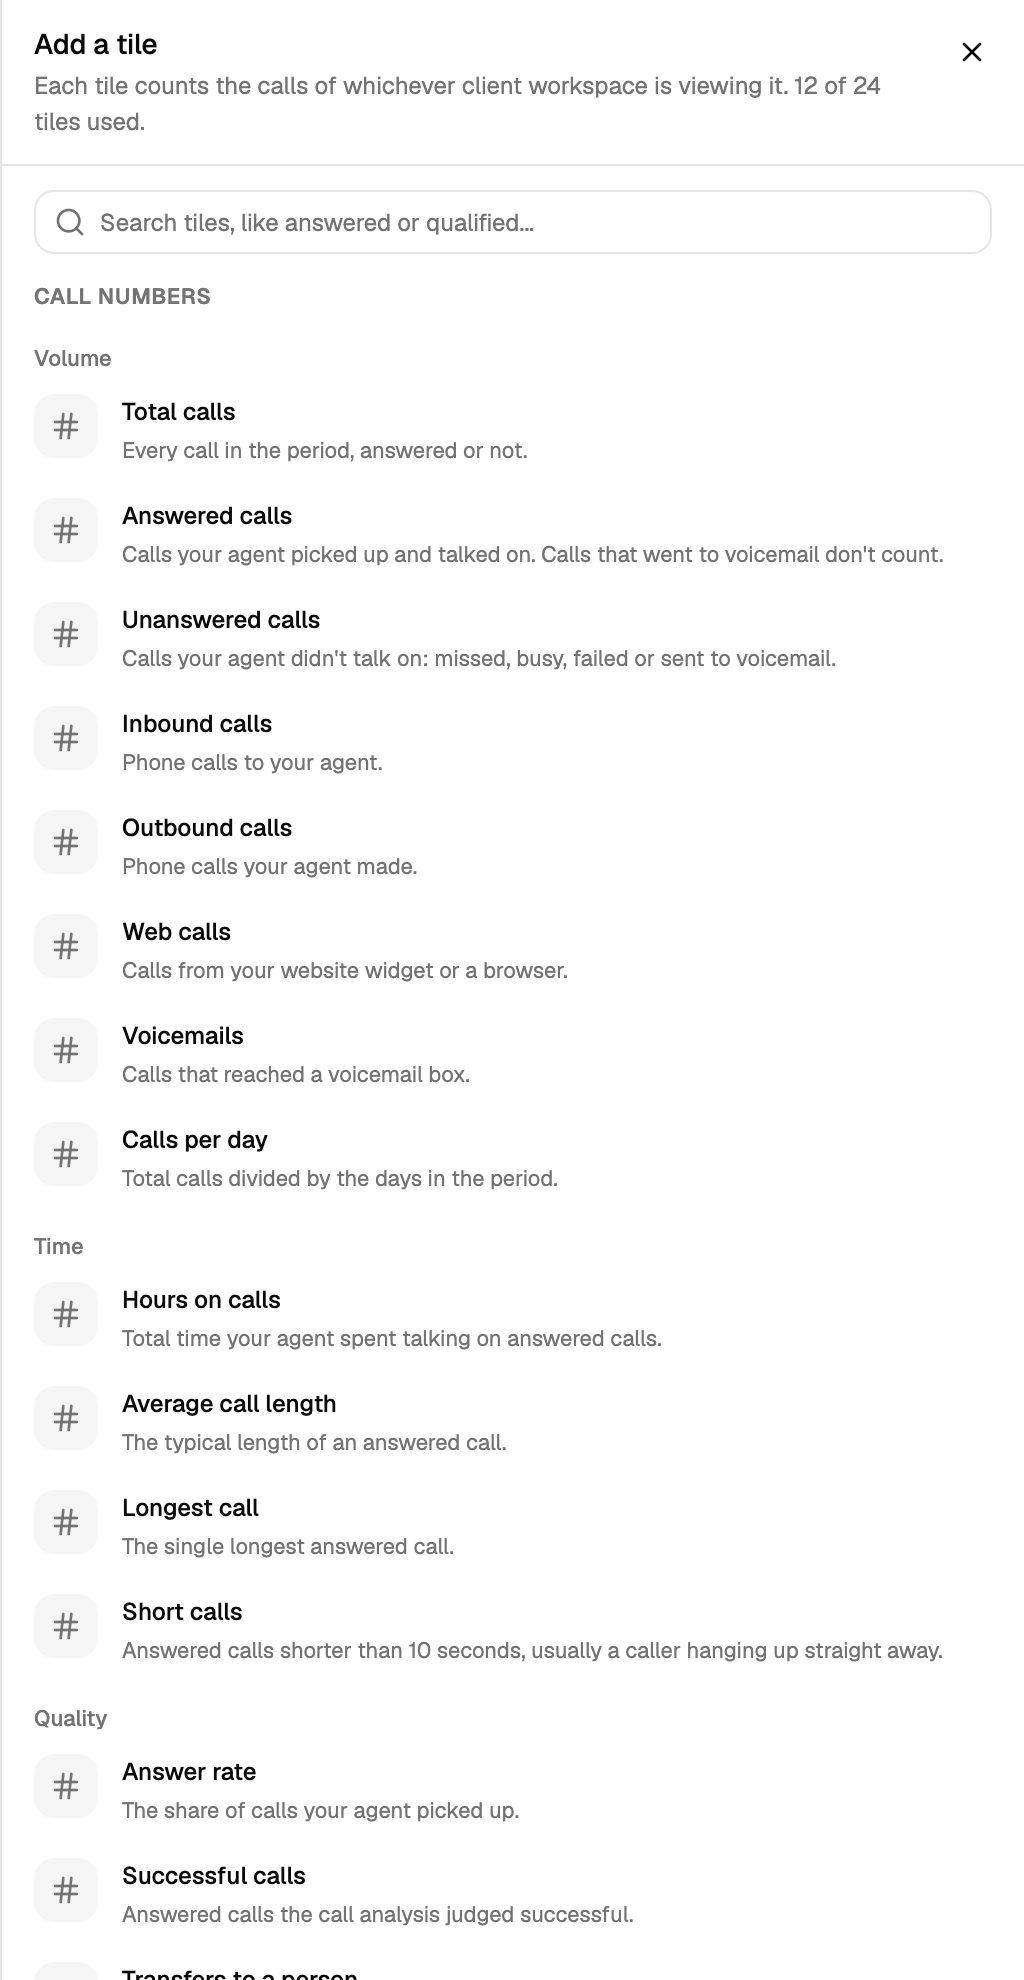
Call number tiles
These count calls on the Pod for the client workspace being viewed.
Volume
Time
Count as time saved turns Hours on calls into Hours saved: you enter how many minutes of your client's time each answered call saves (1 to 240), and the tile shows the total.
Quality
Callers
Not every engine has every tile
A few tiles can't be filled on some engines. They stay on the dashboard, marked "Not available on" followed by the engine name, and clients don't see them:
How a tile can be shown
Open a tile's settings and choose Show as:
- Trend draws a line over the period. You can switch it between hour, day, week and month.
- Bar can Break down by agent or by direction (inbound, outbound, web).
- Heatmap shows calls by hour of day and day of week.
- Coverage splits calls into Business hours, After hours and Weekend, using the business hours in the dashboard settings. Clients can click a coverage tile to filter the whole dashboard to those calls.
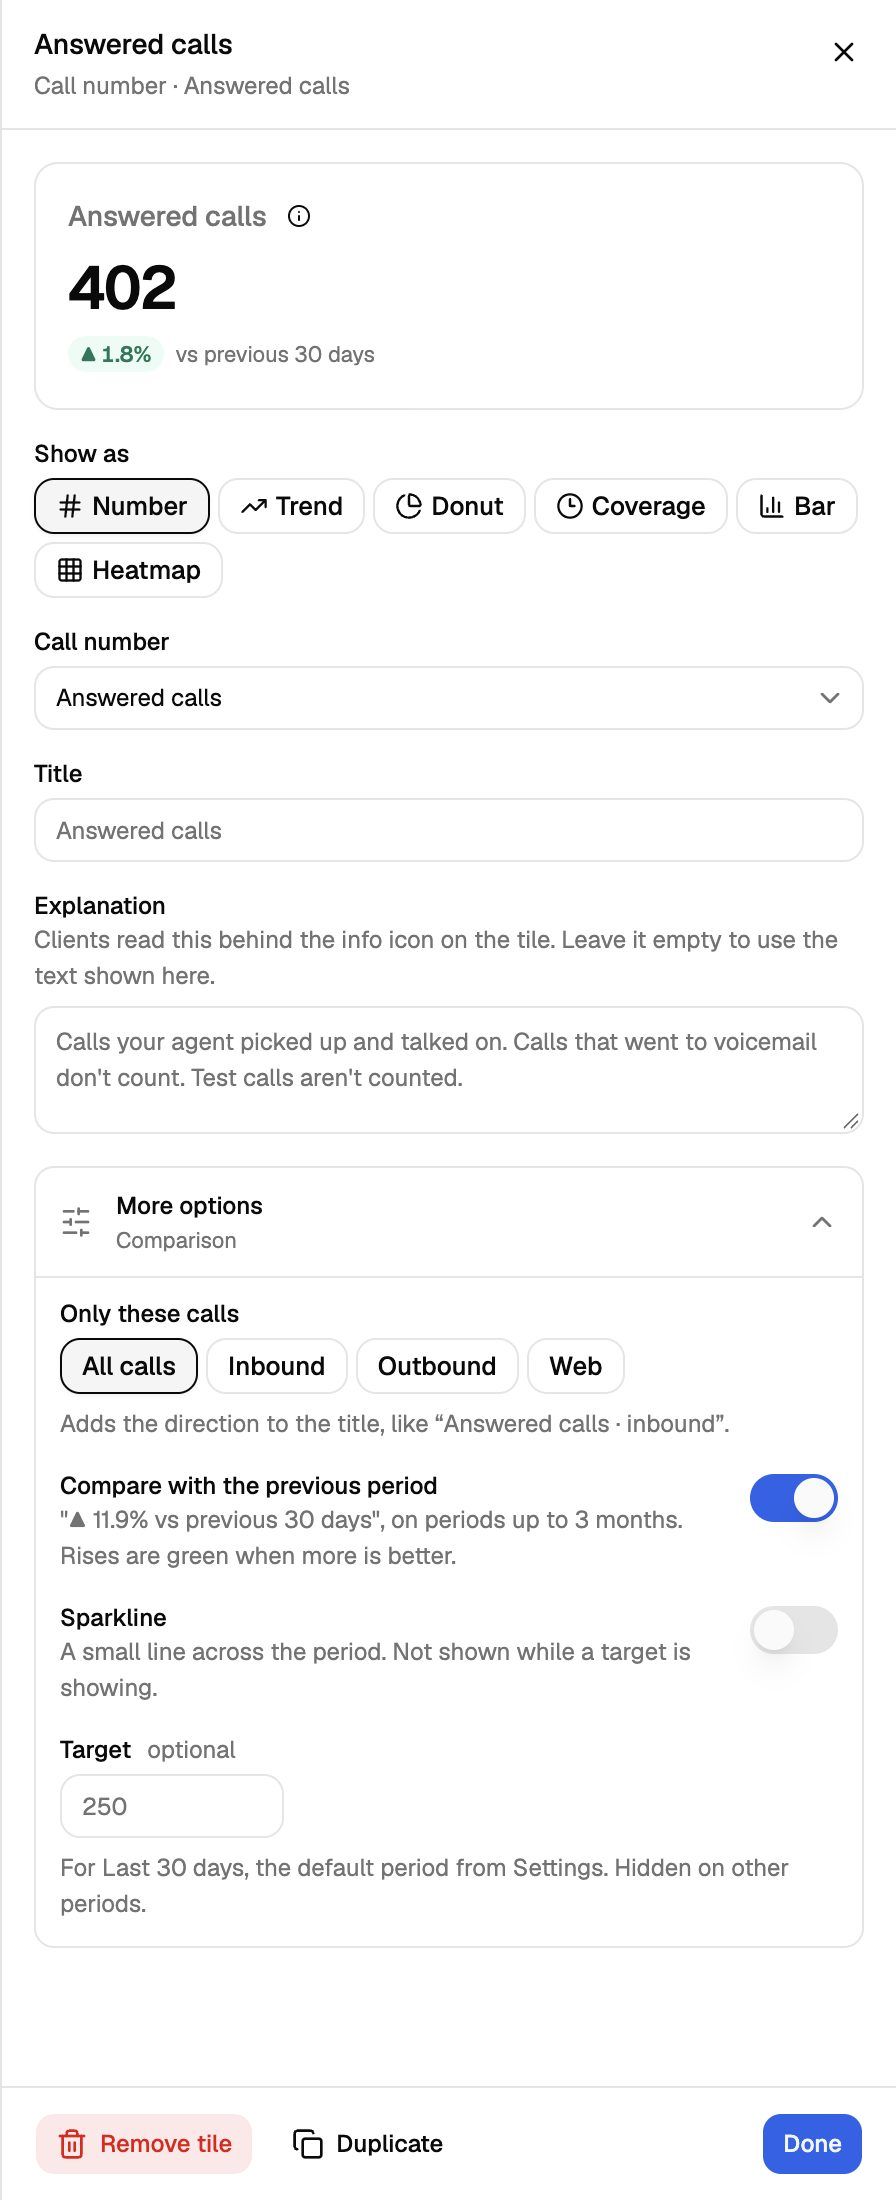
More options
- Only these calls: count all calls, or only inbound, outbound or web calls.
- Compare with the previous period: show the change against the same number of days just before. Comparisons work for periods up to 3 months.
- Sparkline: a small trend line under the number.
- Target: a number to aim for, shown as progress ("12 of 20 target"). It only applies to the period the dashboard opens on.
- Title and Explanation: rename the tile and change the help text clients see.
Field tiles: numbers from your agents' fields
Field tiles count calls by what your agents recorded after the call, for example "qualified = yes" or "appointment booked". They're how you show business results, not only call volume.
The fields come from each engine's post-call results:
The field list is built from the Pod's last 500 calls with results. If a field hasn't appeared yet, type its exact name, such as booked_appointment.
To set one up:
- Click Add tile, then choose Field tile or one of the fields listed under From your agents' fields.
- Choose a field and a condition. The conditions depend on the field type:
- Add more rows with Add another field if needed (up to 5). A call counts if it matches any row. Calls where none of the fields has a value are left out, and the tile says so.
- Under Show the, choose:
- Count: how many calls match.
- Rate: matching calls as a share of answered calls, or of the calls where the field was recorded. The tile's explanation says which.
- Value: matching calls multiplied by a value per call you enter, in the dashboard currency. Clients see it as an estimate.
- Pick how to show it: Number, Donut, Trend, or Bar (Bar works with one choice field and shows the top ten values).
- Give the tile a title clients will understand, such as "Qualified".
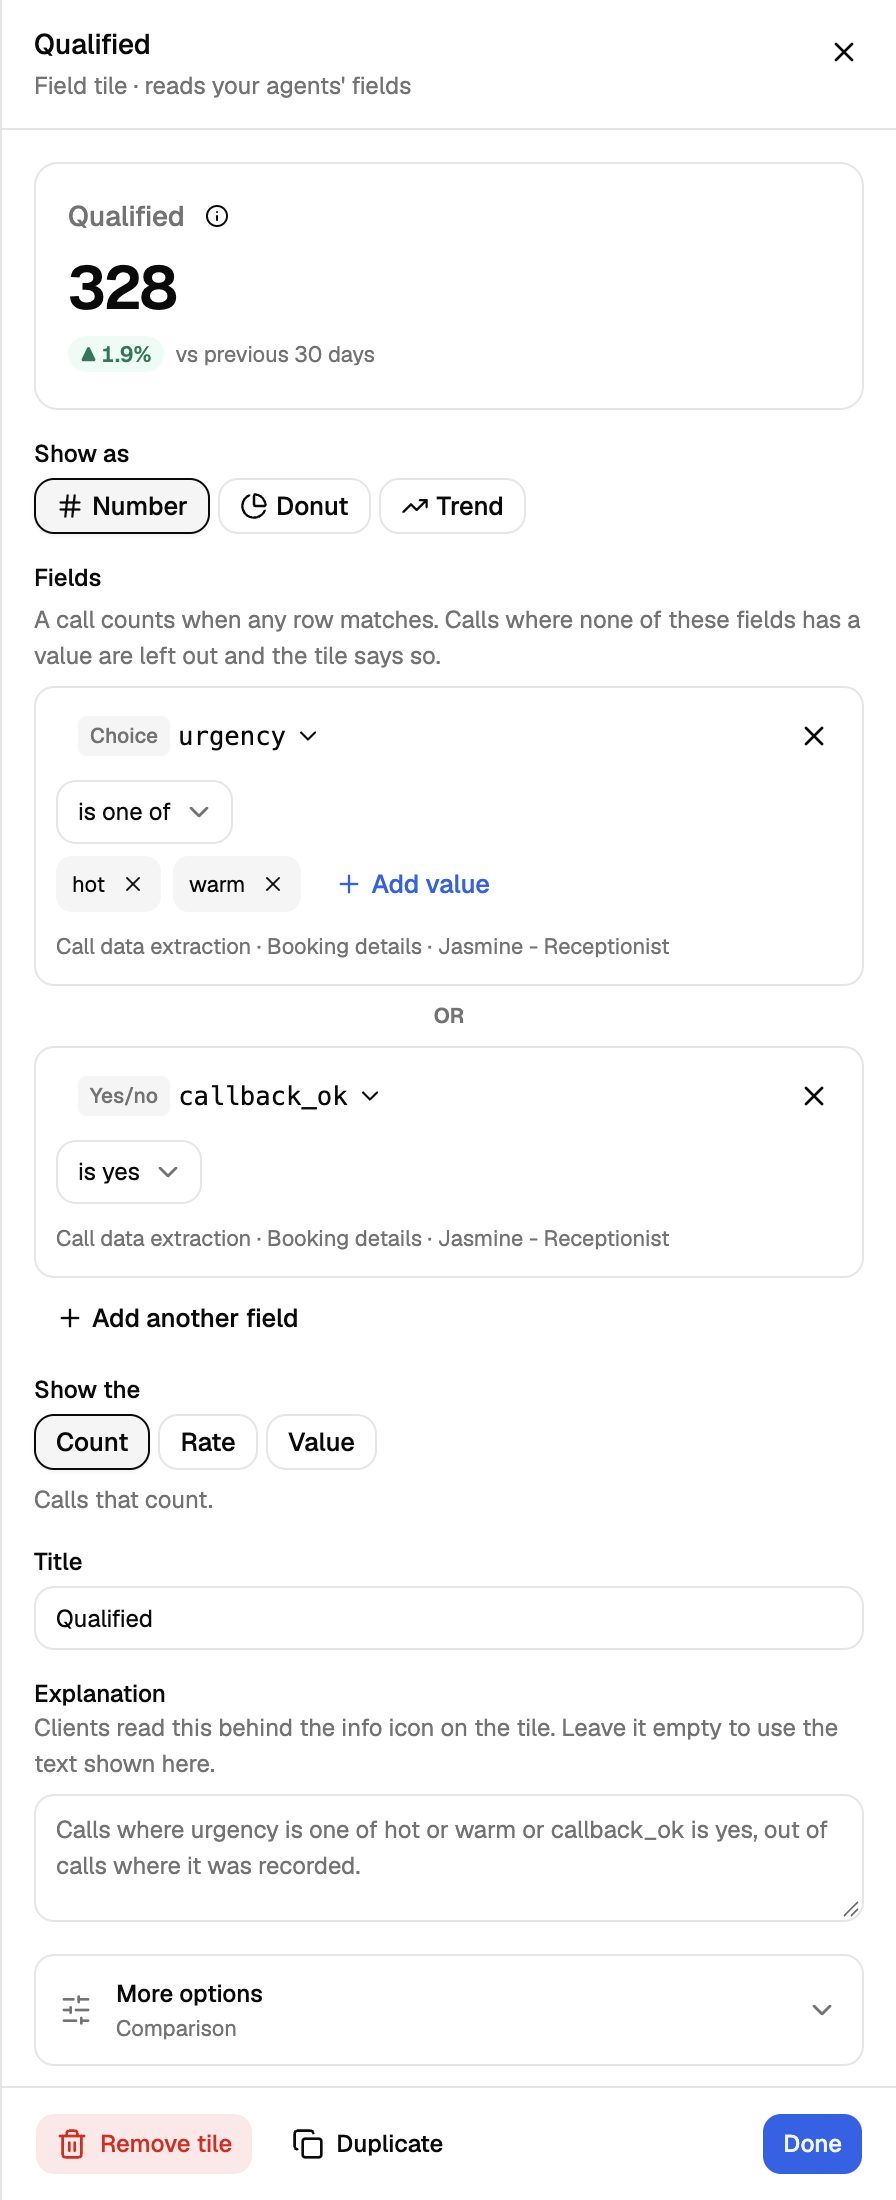
A field tile with no fields picked is hidden from clients until you pick them.
If you copy a dashboard to another Pod, field tiles lose their fields, because each Pod's agents record their own. Open each field tile and pick the fields again.
Layout and other tiles
How calls are counted
- Each client workspace only sees its own calls on the Pod: calls from its campaigns on Vapi, Retell AI and ElevenLabs, and calls of its assigned agents on VAW Native.
- Calls are dated by when they started. A call in progress counts today.
- Your test calls aren't counted unless Include test calls is on in the dashboard settings.
- All times use the dashboard's timezone, not the viewer's.
Related articles
Was this helpful?
Still need help? Share an idea